European equities vs US equities valuation gap
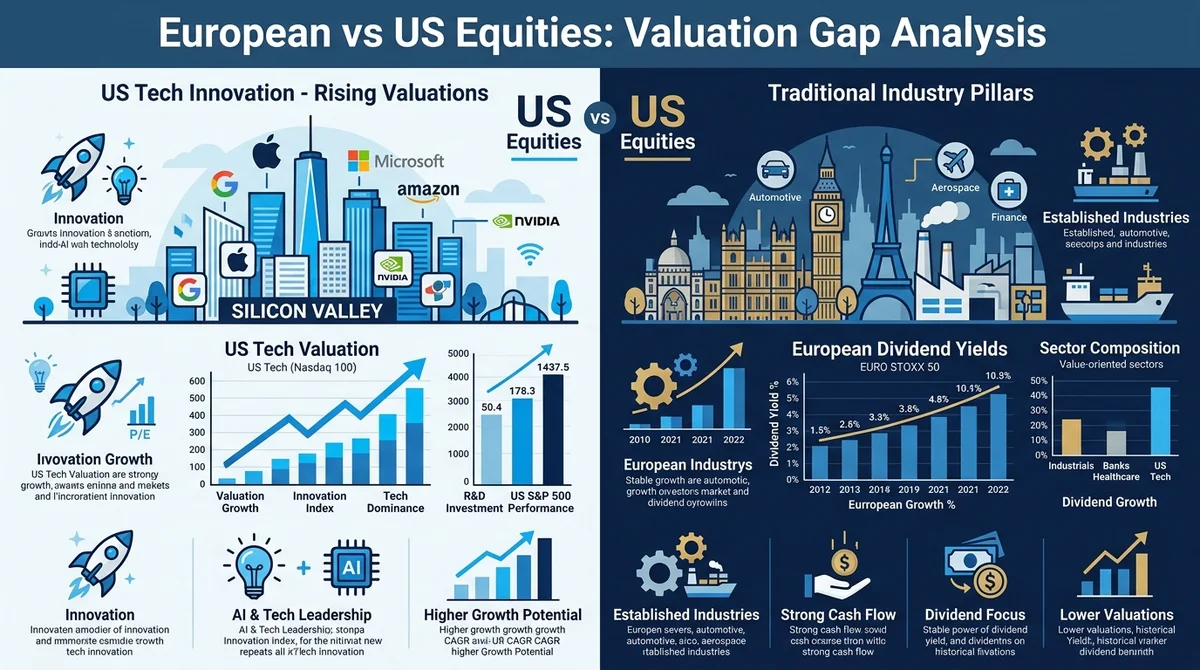
Compare P/E, P/B, dividend yields, and sector compositions of European vs. US equities to understand the valuation premium and allocation strategies.
Key takeaway: If you prioritize high capital gains and the tech innovation premium, US equities have historically shown stronger growth upside; if you seek high dividend cash flow and defensive qualities, European equities offer a relative valuation advantage.
A persistent valuation divergence has long existed between US and European equities across major global capital markets. Over the past decade and more, US equities have consistently traded at a valuation premium compared to European equities. This gap is not only reflected in aggregate Price-to-Earnings (P/E) and Price-to-Book (P/B) multiples, but also highlights fundamental differences in industry structure, shareholder return models, and capital liquidity between the two markets.
#Across Which Key Dimensions Does the European vs. US Valuation Gap Appear?
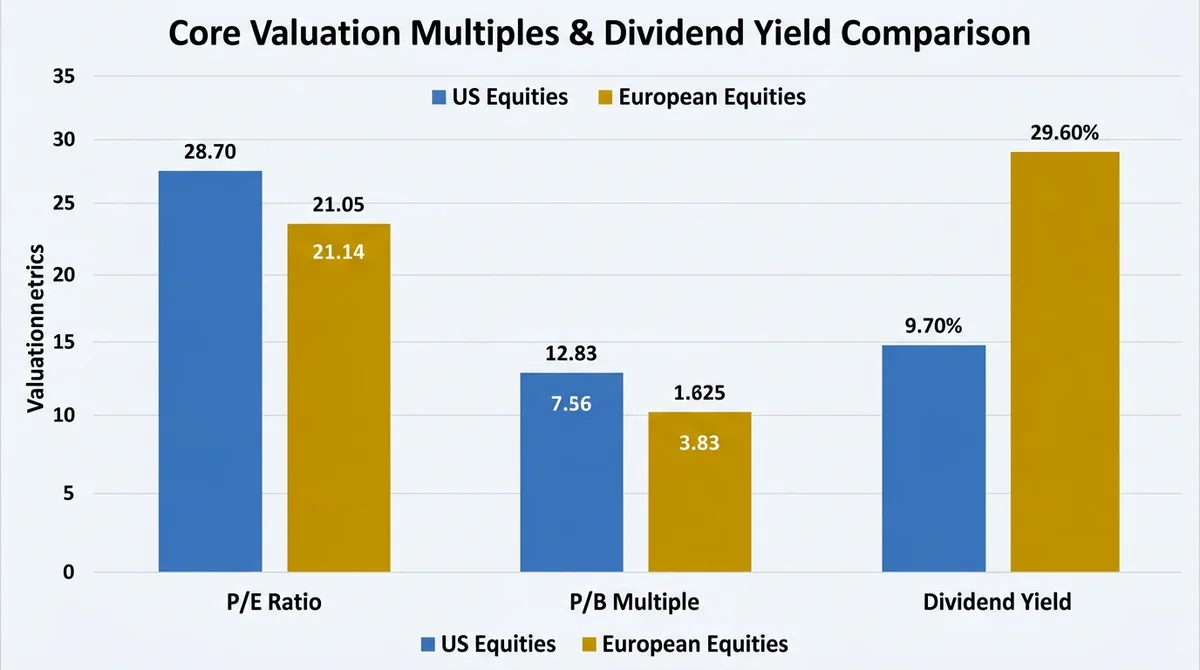
#Core Valuation Metrics Comparison (P/E, P/B, and Dividend Yield)
Overall valuation multiples for US equities have remained consistently higher than those of European equities. US market valuations are heavily supported by high earnings growth expectations from leading tech giants, commanding a higher growth premium. Conversely, the European market is dominated by traditional cyclical and defensive sectors, resulting in notably lower average P/E and P/B medians. In contrast, major European equity indices typically offer a distinct dividend yield advantage, with cash dividend returns generally exceeding broader US market benchmarks.
#Multi-Dimensional Comparison: European vs. US Stock Markets
| Comparison Dimension | European Equities | US Equities |
|---|---|---|
| Valuation Multiples (P/E / P/B) | Relatively low, showing a persistent valuation discount | Relatively high, enjoying a significant valuation premium |
| Dividend Yield | Generally high, strong dividend culture | Relatively low, preferred shareholder return via share buybacks |
| Core Leading Sectors | Financials, Industrials, Consumer Goods, Energy, Healthcare | Tech Innovation, Software, Internet Platforms, Communication Services |
| Shareholder Return Methods | Primarily cash dividends | Combined share buybacks and dividends |
| Market Depth & Liquidity | Fragmented across Euronext, London, Frankfurt, and other exchanges | Concentrated on NYSE and Nasdaq, offering deep global liquidity |
| Earnings Growth Expectations | Low-to-moderate stable growth with prominent cyclical patterns | Moderate-to-high growth expectations driven by innovation |
| Denomination Currencies | EUR, GBP, CHF, etc. | USD |
| Global Capital Pricing Power | Dominated by regional pricing, highly sensitive to cross-border capital flows | Priced in the primary global reserve currency, core anchor for global institutional capital |
#What Drives the Long-Term Valuation Divergence Between US and European Equities?
#Sector Imbalance: Tech Innovation Giants vs. Traditional Industries
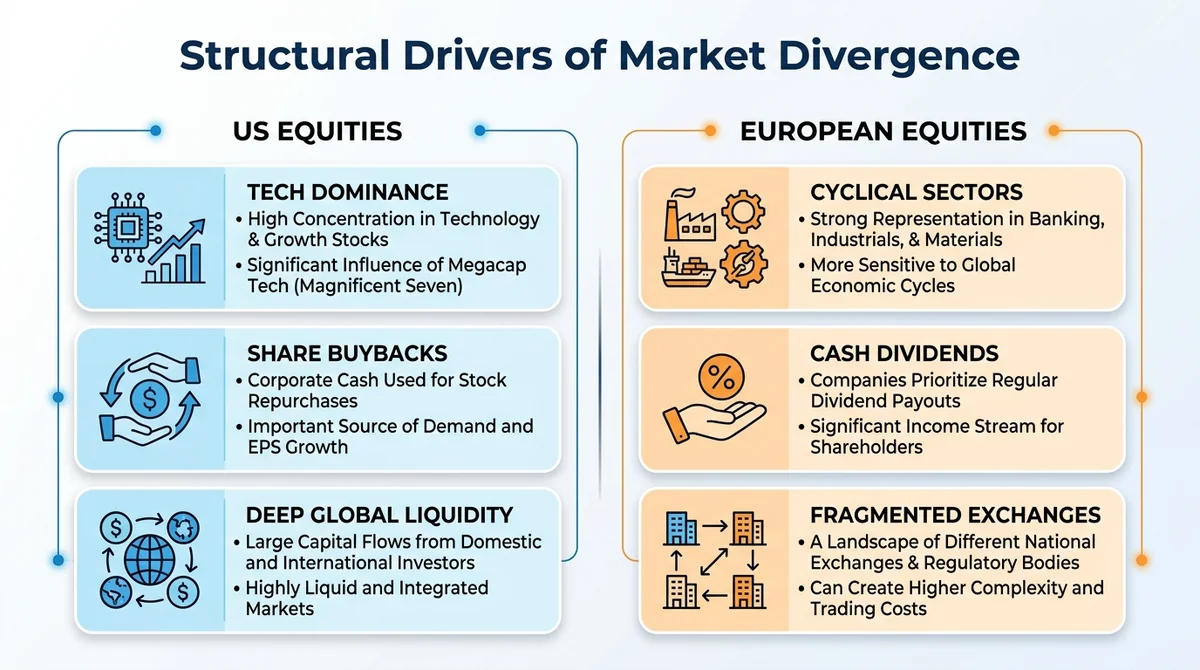
Structural differences in sector composition are the primary driver of the valuation gap between US and European markets. In the US S&P 500 and Nasdaq indices, Information Technology and Communication Services hold dominant index weightings; sustained earnings growth from tech leaders lifts overall US market valuations. In contrast, major European indices (such as the EURO STOXX 50 and FTSE 100) are heavily weighted toward banks, utilities, industrial manufacturing, and energy/chemicals. Valuation models for these capital-heavy and cyclical industries struggle to support high valuation multiples.
#Earnings Growth Expectations and Shareholder Return Models (Dividends vs. Buybacks)
Corporate capital allocation approaches differ substantially between the two regions. US-listed companies lean heavily toward large-scale share buybacks, directly boosting earnings per share (EPS) by reducing outstanding share counts, which drives up share prices and valuation multiples. European corporations largely adhere to traditional cash dividend policies, which provide immediate cash returns but do not directly accelerate EPS growth like share buybacks do.
#European Equities vs. US Equities: How to Decide Based on Investment Goals?
When formulating a cross-regional asset allocation strategy, investors should align choices with their risk tolerance and cash flow requirements:
- Targeting Capital Gains and Long-Term Growth: Prioritize US equities. The US market features an established R&D ecosystem and a concentration of tech leaders, typically demonstrating higher upside beta during bull market cycles. For selecting between US equities and tokenized assets, refer to Tokenized US Stocks vs Real US Stocks: Shortest Path to Entry Selection in 2026 (MSX Compare Framework).
- Seeking Dividend Cash Flow and Low-Valuation Defense: Increase exposure to European equities. High-dividend European blue-chip stocks provide consistent cash dividend returns in volatile or high-interest-rate environments, offering relative defensive characteristics.
- Multi-Asset Synergy and Regional Diversification: Implement a hybrid US-Europe multi-asset allocation strategy. Combining US growth stocks with European value blue-chips helps mitigate portfolio dependency on a single monetary policy regime or regional economic cycle. For detailed differences between holding physical shares versus on-chain equity instruments, see Direct Stock vs Tokenized Stock: Ownership, Tax, and Platform Risk in 2026.
#Key Risks to Consider in Cross-Regional US and European Equity Investing
#Currency Fluctuations Eroding Multi-Currency Asset Returns
Investing in European equities generally involves exposure to foreign currencies such as the Euro, British Pound, or Swiss Franc. When the US dollar strengthens, FX translation losses can diminish or entirely offset capital gains and dividend yields from underlying assets.
#Macro Policy Divergence and Liquidity Differences
Monetary policy paths between the European Central Bank (ECB) and the Federal Reserve may diverge, and geopolitical tensions often create more direct disruptions for the European domestic economy. Furthermore, European equity liquidity is fragmented across multiple exchanges, lagging US market depth and potentially incurring higher execution friction and wider bid-ask spreads during large portfolio rebalancing.
#Disclaimer & Risk Warning
This content is compiled from public market information and does not constitute investment advice, an offer to buy or sell, or a guarantee of returns. Market data and conditions are subject to change. Investors should make independent judgments based on their personal financial situation, risk appetite, and local tax jurisdiction regulations.
FAQ
Why do European equities trade at a persistent valuation discount to US equities?
The primary reasons are differences in sector composition and shareholder return mechanisms. The US market is dominated by high-growth, high-P/E tech sectors and relies heavily on share buybacks to enhance EPS, whereas European equities lean toward traditional cyclical industries like financials, industrials, and energy, with returns distributed primarily as cash dividends.
Which type of investor is best suited for European equity allocation?
European equities are well-suited for investors seeking immediate dividend cash flow, defensive assets with lower valuation multiples, and broader diversification to reduce concentration risk in single USD-denominated assets.
What specific risks should investors monitor when investing in European equities?
Key risks include FX fluctuations that can erode total returns, slippage costs caused by fragmented liquidity across multiple European exchanges, and the impact of regional macroeconomic shifts and geopolitical developments.
Related Terms
Done comparing? Ready to place your first trade?
The crypto assets, tokenized US stocks and ETFs you just compared are all tradable on MSX — spot or perpetuals.
Quick Start Trading →New here? Registration takes three quick steps.