SK Hynix vs Micron: Which Memory Stock Is Better in 2026?
We compare SK Hynix vs Micron on HBM market share, earnings growth, valuation, and risks to help you decide which memory stock fits your portfolio in 2026.
#SK Hynix vs Micron: Which Memory Stock Is Better in 2026?
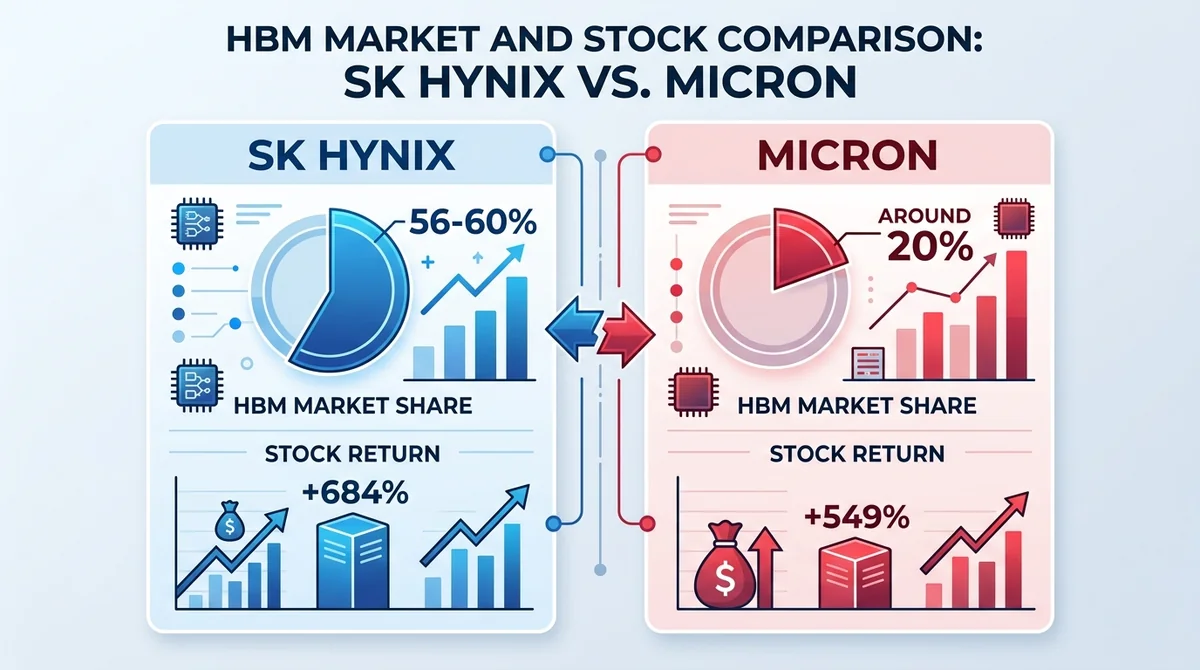
SK Hynix leads the HBM market with an estimated 56–60% share, while Micron is growing faster from a smaller base. Over the past 12 months, Micron stock returned +684% versus +549% for SK Hynix. However, both face the same memory cycle risks. This comparison breaks down HBM share, earnings growth, valuation, and risks.
#Key Takeaways
- SK Hynix controls roughly 56–60% of the HBM market; Micron holds about 20% but is sold out of HBM4 into 2027.
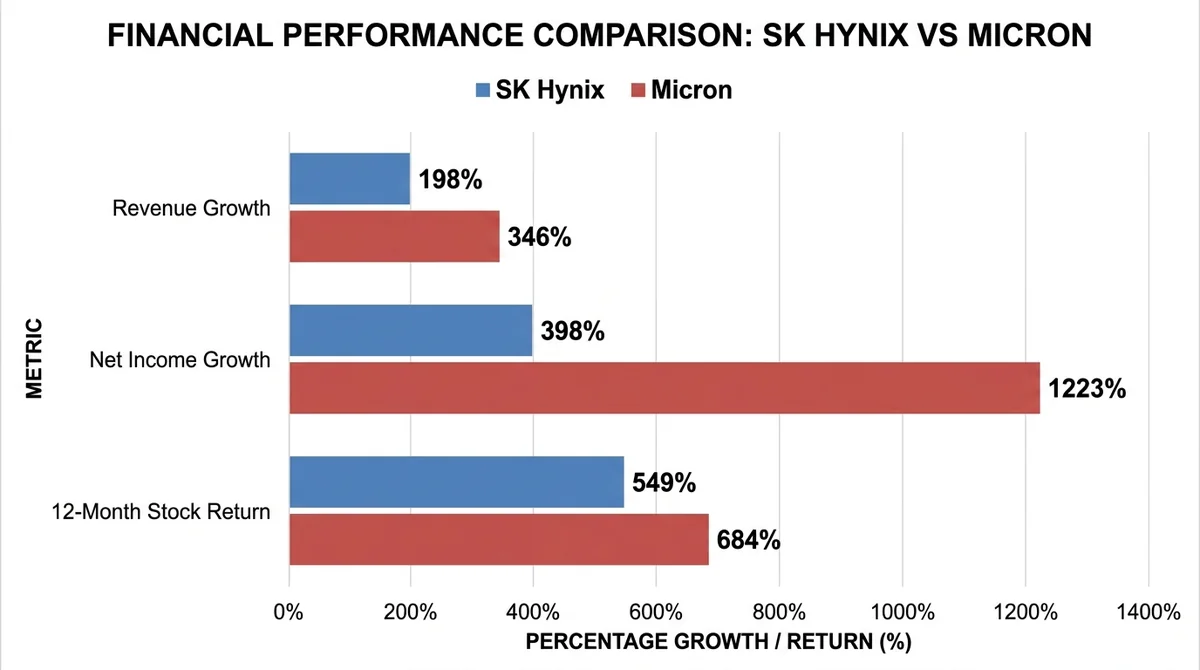
- Micron’s revenue grew 346% year over year and net income surged 1,223% in its fiscal Q3 2026, outpacing SK Hynix’s 198% revenue and 398% profit growth.
- Micron delivered a 684% trailing 12-month return versus SK Hynix’s 549%, according to Alpha Spread.
- Memory cyclicality and capacity expansion are the biggest risks for both stocks.
#What Is Driving the Memory Market Boom for SK Hynix and Micron?
AI data center demand for high-bandwidth memory (HBM) and inference workloads is the primary driver behind the memory market boom, pushing DRAM prices sharply higher and squeezing supply for both companies.
#How AI data centers are fueling HBM demand
Data centers require HBM to package with GPUs and AI accelerators. Inference workloads are even more memory-reliant than training, so the shift from AI model training to inference is amplifying demand. This benefits both SK Hynix and Micron, as they are the two largest pure-play DRAM suppliers behind Samsung.
#Why capacity constraints are pushing DRAM prices higher
HBM production uses up to three times the wafer capacity of standard DRAM, and EUV lithography capacity is limited by ASML equipment availability. Because all three major DRAM makers are prioritizing HBM, ordinary DRAM is also in short supply, sending prices for all DRAM types skyrocketing.
#How Does SK Hynix Compare to Micron in HBM Market Share?
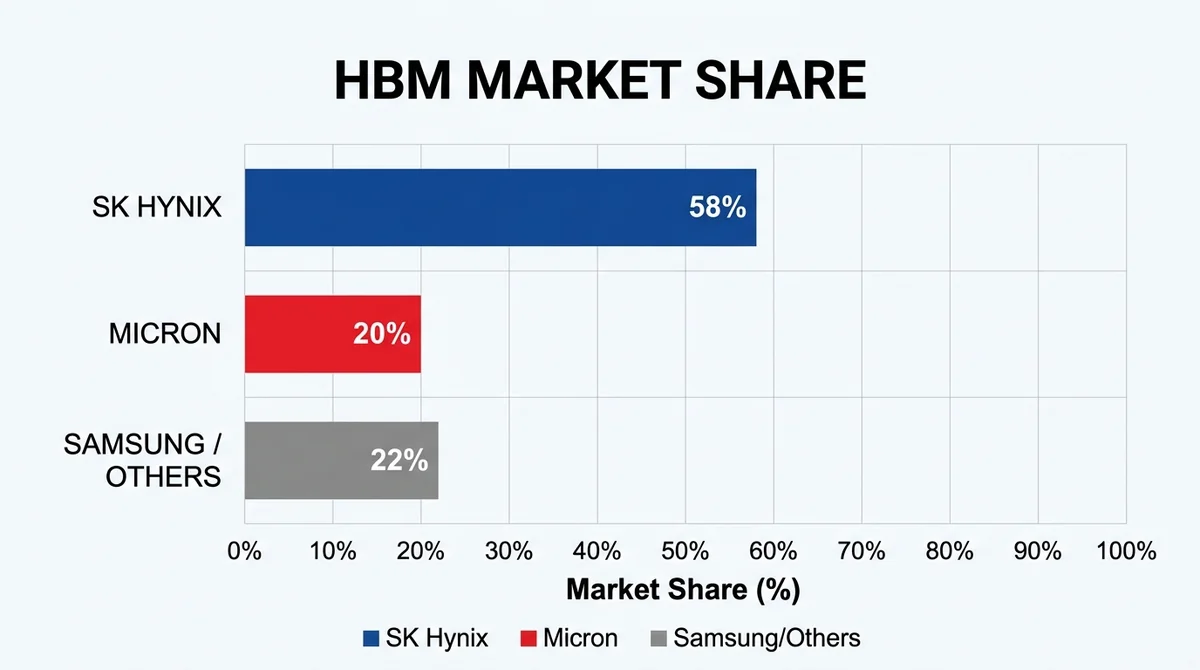
SK Hynix dominates HBM market share with an estimated 56–60% share, while Micron holds around 20% but is ramping production rapidly.
#SK Hynix's early lead and Nvidia partnership
SK Hynix began HBM production in 2013 and is the largest HBM producer. It controls 56% of the HBM market, with some sources citing near 60%, and has formed a partnership with Nvidia. This gives SK Hynix integration advantages with the dominant AI accelerator maker.
#Micron's HBM4 ramp and sold-out status
Micron holds about 20% market share, but it has started high-volume production of 36GB 12-Hi HBM4 chips tailored for Nvidia's Vera Rubin architecture. Micron's HBM4 capacity is sold out through 2026 and even well into 2027, making it a formidable challenger despite the share gap.
#Which Memory Stock Is Growing Faster: SK Hynix or Micron Earnings?
Micron is growing faster on a percentage basis, with revenue up 346% year over year and net income up 1,223% year over year, compared to SK Hynix's 198% revenue growth and 398% net profit growth.
#SK Hynix's recent revenue and profit growth
For the quarter ended March 31, 2026, SK Hynix reported revenue of KRW 52.58 trillion, up 198% year over year, and net profit of KRW 40.35 trillion, up 398%. This reflects strong HBM leadership and tight DRAM pricing.
#Micron's explosive earnings acceleration
Micron posted revenue of $41.46 billion for its fiscal Q3 2026 (ended May 28, 2026), up 346% year over year. Net income was $28.86 billion, up 1,223% year over year. Micron's faster growth rate is partly due to its lower starting base in HBM production compared to SK Hynix.
#How Do SK Hynix and Micron Valuation and Stock Performance Compare?
Micron has outperformed SK Hynix over the past 12 months, delivering a total return of +684% compared to SK Hynix's +549%, according to Alpha Spread data.
#Trailing 12-month stock returns: Micron leads
Alpha Spread data shows that over the past 12 months, SK Hynix returned +549% while Micron returned +684%. This indicates stronger recent share price performance for Micron, though both stocks have surged dramatically.
#What to know about SK Hynix vs Micron forward P/E and P/E ratios
Investors searching for SK Hynix vs Micron forward P/E or P/E ratio should note that precise valuation multiples reside behind paid data platforms. Alpha Spread offers comparisons of P/S, P/E, EV/EBITDA, and more, but the free tier does not expose the exact figures. Because both stocks have surged, valuation analysis must account for cyclical peak earnings and HBM growth sustainability. For another AI chip stock comparison, see our AMD vs Nvidia stock comparison.
#What Are the Biggest Risks Facing Micron and SK Hynix Stock?
The biggest risk for both Micron and SK Hynix is memory market cyclicality: as suppliers expand capacity, supply could outpace demand and erode pricing power.
#Memory market cyclicality and oversupply risk
The memory chip market is historically volatile. Current tight supply is prompting all major players to expand production capacity. Eventually, supply should catch up to—and likely exceed—demand, sapping pricing power. In previous cycles, this has led to steep sell-offs in memory stocks.
#Capacity expansion race and pricing power erosion
Both companies are heavily exposed to the same cyclical forces. If capacity expansion outruns demand growth, pricing power will weaken, and both SK Hynix and Micron stock could see sharp corrections. Timing and capacity discipline will be critical for investors.
FAQ
Is SK Hynix or Micron a better buy in 2026?
There is no clear winner: SK Hynix has a dominant HBM market share, while Micron has faster growth and stronger trailing 12-month returns.
What is SK Hynix's HBM market share compared to Micron?
SK Hynix controls an estimated 56–60% of the HBM market, while Micron holds around 20%.
How fast are SK Hynix and Micron growing earnings?
Micron grew revenue 346% year over year and net income 1,223% year over year in its fiscal Q3 2026, outpacing SK Hynix's 198% revenue growth and 398% net profit growth.
What is the forward P/E for SK Hynix vs Micron?
Exact forward P/E ratios are behind paid platforms like Alpha Spread; free data only shows that Micron's 12-month return of +684% beats SK Hynix's +549%.
What are the main risks of investing in SK Hynix or Micron?
The primary risk is memory market cyclicality and oversupply, as capacity expansion could erode pricing power and trigger steep stock sell-offs.
Related Terms
Done comparing? Ready to place your first trade?
The crypto assets, tokenized US stocks and ETFs you just compared are all tradable on MSX — spot or perpetuals.
Quick Start Trading →New here? Registration takes three quick steps.