Micron (MU) vs SK Hynix: Who Delivers First in 2026 — HBM Contract Prices or the Inventory Cycle Turning Point?
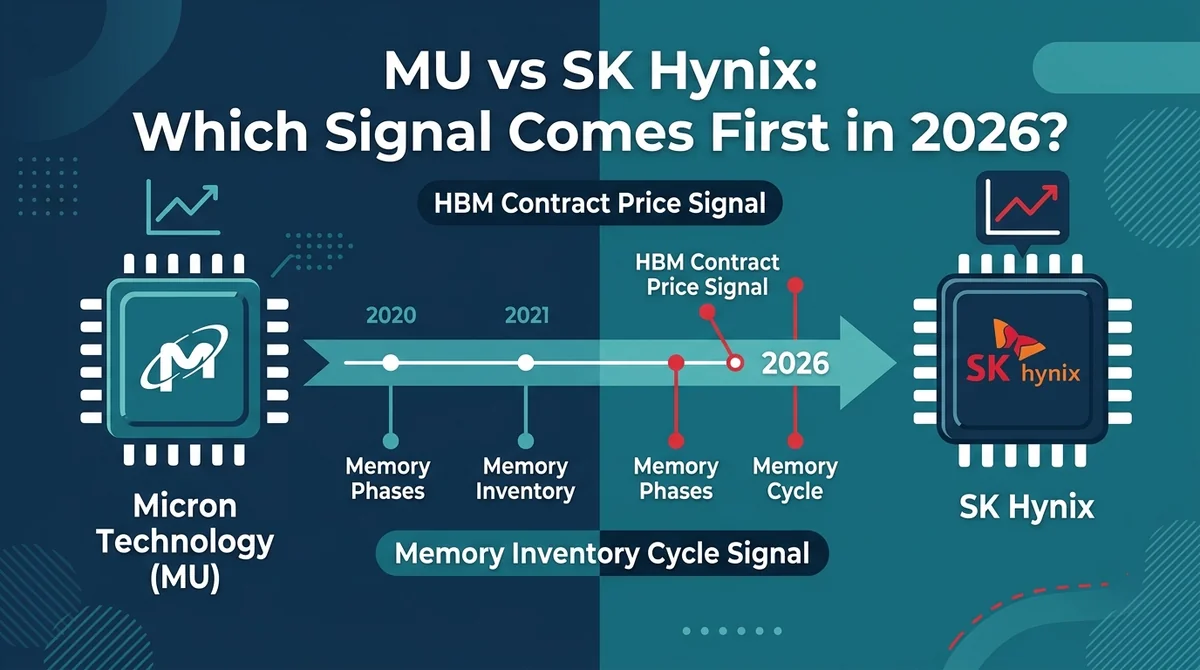
Comparing MU and SK Hynix across business mix, HBM contract pricing and inventory cycle signals — a watchlist of indicators, no price forecasts.
Conclusion: From a mechanism standpoint, SK Hynix — with its higher HBM weighting and deeper customer ties — may react earlier on the price-side signal of contract pricing; MU, with its full-category coverage, is easier to observe on the supply-side signal of standard memory inventory days. This is not a question of "which company is better," but of two different observation curves — judging which comes first requires watching both contract signing progress and inventory days, not a single indicator. This article is a mechanism-level inference and does not constitute a forecast of specific timing.
#MU vs SK Hynix: Where Exactly Do the Two Companies Differ in HBM and Memory Business?
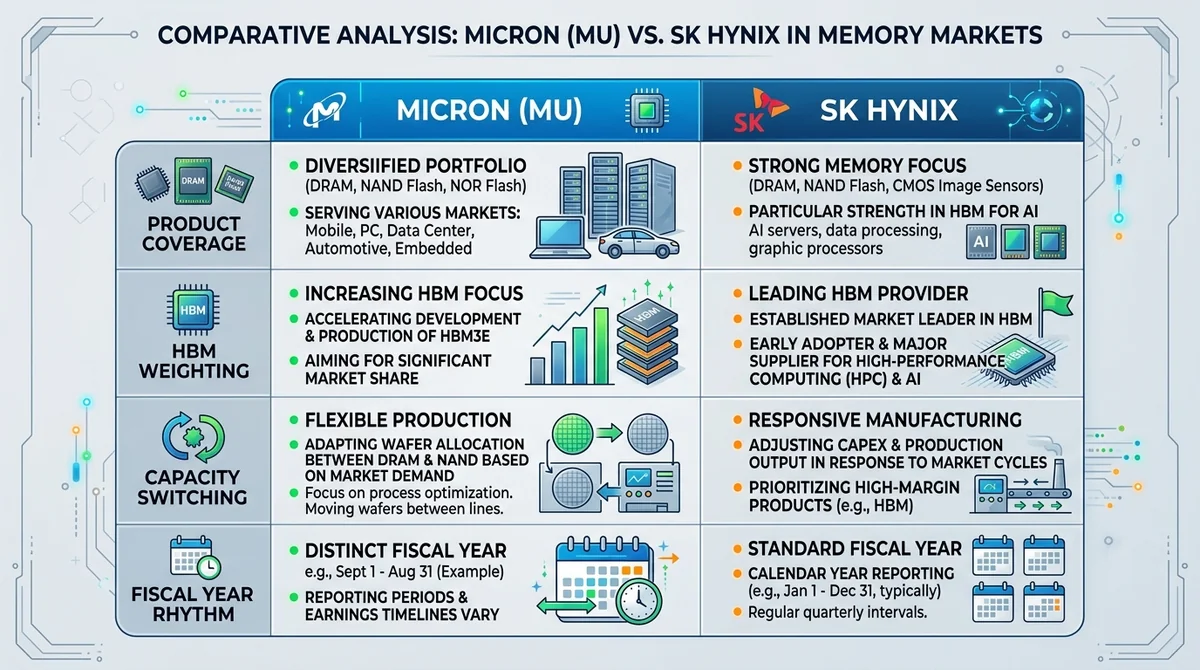
Business structure: MU covers the full DRAM and NAND categories, with HBM as an incremental elasticity source rather than the whole picture; SK Hynix has a relatively higher HBM weighting, with its memory product mix more concentrated in high-value-added DRAM. This structural difference means that in the same cycle, the line items that "move first" in each company's financials may differ.
Role of HBM: At SK Hynix, HBM has a more direct impact on revenue structure and bargaining position; at MU, HBM is more of an incremental business, and its marginal contribution to overall revenue needs to be measured against the standard DRAM/NAND base. The two companies differ in HBM product generations and depth of customer ties; specific generation mass-production timing, customer lists and per-product revenue shares are commercially sensitive, and this article does not speculate where data is undisclosed.
Capacity allocation: HBM requires more wafers and advanced packaging resources, and the flexibility of switching capacity from standard memory to HBM is not symmetric between the two. SK Hynix, given its high HBM weighting, may have greater "certainty" in switching; MU, with a fuller category lineup, may have greater "flexibility" but its pace is constrained by overall capacity planning. Specific capacity figures and allocation ratios are undisclosed.
Key judgment: Differences in business structure are not a judgment of better or worse, but may determine that the two companies react at different points on the two curves of contract pricing and inventory cycle.
#2026 HBM Contract Prices: How Do the Two Companies' Negotiation Paces and Delivery Paths Differ?
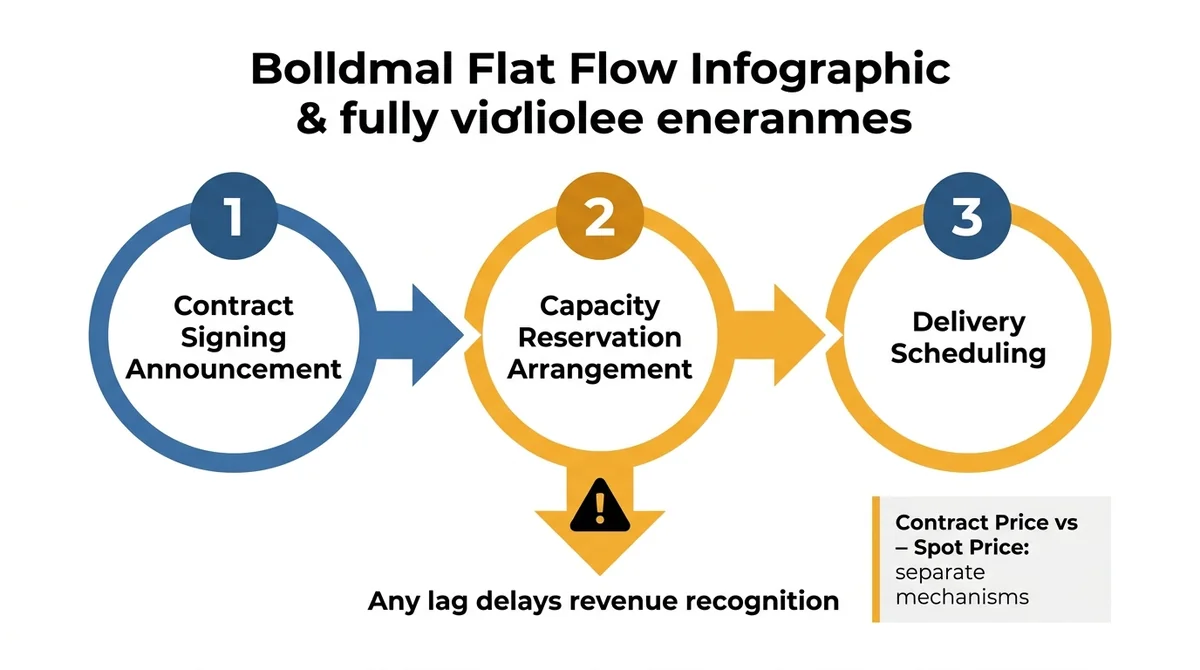
Mechanism note: HBM contract prices are typically set through annual or quarterly long-term agreement negotiations, a separate mechanism from spot market quotes. Contract prices reflect customers' willingness to lock in future supply; spot prices reflect immediate supply-demand gaps. The two cannot be conflated.
Negotiation position: SK Hynix, with deeper customer ties and a higher HBM revenue weighting, may hold a relatively more stable position in long-term agreement negotiations; MU relies on new capacity coming online and customer expansion to win share, so its negotiation pace is strongly correlated with capacity ramp progress. This is a mechanism inference, lacking public evidence on contract negotiation details.
Delivery signals: Whether contract prices are "delivered" is not judged by verbal guidance but by three observable actions — contract signing announcements, capacity reservation arrangements, and delivery scheduling. If any of the three lags, the financial recognition of contract prices is pushed back. This article does not forecast specific 2026 contract price levels, because prices are undisclosed commercial negotiation information.
Alignment basis: The two companies have different fiscal-year rhythms (MU's fiscal year does not match the calendar year, while SK Hynix uses the calendar year), so the timing of contract price recognition in financial statements will also be misaligned. Cross-company comparison requires aligning reporting periods first; otherwise, timing differences are easily misread as strength differences.
#Memory Inventory Cycle Turning Point: Whose Data Is More Telling?
Three core clues: Inventory days, capital expenditure, and capacity utilization. Inventory days reflect the immediate state of supply-demand tightness, capex reflects manufacturers' judgment on medium-term demand, and capacity utilization reflects actual output pace. Signals are relatively more reliable when all three point the same way; divergence requires additional evidence.
Disclosure basis differences: The two companies differ in inventory disclosure basis and fiscal-year rhythm. Direct comparison of absolute values is of limited meaning; statistical scope and reporting periods should be aligned first, then the direction and slope of change compared. Some granular data is undisclosed.
Transmission speed: Product mix may affect the speed at which the turning point transmits. Companies with a high standard memory weighting see inventory-side changes appear earlier in statements; companies with a high HBM weighting have inventory fluctuations smoothed by long-term agreements, making the turning point less visible in statements — though that does not mean the actual cycle does not exist.
#HBM Contract Prices vs the Inventory Cycle Turning Point: Which Comes First, and How to Judge?
Timing relationship: Contract prices are on the price side, the inventory turning point is on the supply side, and there is a transmission lag between them. The price side usually shows directional change before the supply side, but contract prices have a recognition delay due to the long-term agreement mechanism, so "which comes first" depends on which layer you observe — negotiation signals move first, financial recognition follows. This sequence is a mechanism inference; actual pace should be based on company disclosures.
Segmented judgment:
- If you are a reader focused on industry trends: Prioritize contract signing and capex guidance, which typically lead changes in inventory days.
- If you are a reader focused on supply chain and procurement: Prioritize capacity reservations and delivery scheduling, which determine actual availability rather than price levels.
- If you just want to understand the concepts: First distinguish contract prices vs spot prices and HBM vs standard memory, then discuss sequencing.
- If you are comparing the two companies' cyclical elasticity: SK Hynix, with higher HBM weighting, may react earlier on the price side; MU, with higher standard memory weighting, may show clearer inventory-side signals.
Watchlist of observable signals: ① Long-term agreement signing and renewal announcements; ② Annual capex guidance adjustments; ③ Quarter-over-quarter direction of inventory days; ④ Capacity utilization commentary; ⑤ Pace of advanced packaging capacity deployment. All of the above are publicly verifiable qualitative or directional information; specific figures are subject to company disclosures.
#How Should Readers With Different Goals View This Comparison?
Industry trend perspective: The core variables are the contract pricing mechanism and capex pace; the focus is judging whether price-side signals have transmitted to the supply side.
Supply chain procurement perspective: The core variables are capacity reservations and delivery scheduling; the focus is availability and lead times, not price forecasts.
Conceptual understanding perspective: First distinguish four pairs of concepts — contract prices vs spot prices, HBM vs standard memory, price side vs supply side, negotiation signals vs financial recognition.
Information priority: Company quarterly reports and earnings calls > industry institution statistics > media paraphrase. The first two can be verified; the latter serves only as a clue.
#Risk Disclosure and Disclaimer
Scope of applicability: The comparison in this article is built on public information and mechanism logic; it describes inferences about "differences in reaction pace," not price forecasts, and does not constitute an evaluative conclusion about any company. Industry supply and demand, customer structure and capacity planning may all change over time, and the conclusions herein are not guaranteed to hold in future periods.
Undisclosed data items: Specific HBM contract prices, customer lists and individual long-term agreement terms, per-product capacity allocation ratios, and granular inventory basis figures are all undisclosed commercial information; this article makes no estimates or speculations.
This content is compiled from public data and does not constitute investment or open account advice. Data is as of 2026-01-01 and actual conditions may change. To verify original disclosures, see the investor relations pages and official announcements of both companies.
FAQ
What is the difference between HBM contract prices and spot prices?
The two use different mechanisms: contract prices are set through annual or quarterly long-term agreement negotiations and reflect customers' willingness to lock in future supply; spot prices reflect immediate supply-demand gaps. Contract price recognition also lags negotiation due to delivery scheduling, so the two cannot be conflated.
Why is SK Hynix said to react earlier on contract prices?
This is a mechanism-level inference, not a settled conclusion: its HBM revenue weighting is relatively higher and its customer ties deeper, so its long-term agreement negotiation position may be more stable, and price-side changes may more readily appear first in its business structure. This is a pace difference, not a judgment of better or worse.
Which indicators should be watched for the inventory cycle turning point?
Three clues: inventory days, capital expenditure, and capacity utilization. Signals are relatively more reliable when all three point the same way; divergence requires additional evidence. Note that the two companies differ in disclosure basis and fiscal-year rhythm, so alignment is needed before comparison.
Can the two companies' data be compared directly side by side?
Absolute values cannot be compared directly. The two have different fiscal-year rhythms and inventory disclosure bases; statistical scope and reporting periods should be aligned first, then the direction and slope of change compared. Some granular data is undisclosed.
Does this article provide price forecasts?
No. This article only compares the transmission logic of contract price negotiation mechanisms and inventory signals; it does not forecast specific price levels or recommend any instruments.
Related Terms
Done comparing? Ready to place your first trade?
The crypto assets, tokenized US stocks and ETFs you just compared are all tradable on MSX — spot or perpetuals.
Quick Start Trading →New here? Registration takes three quick steps.