NVDA Spread Comparison: Tokenized NVIDIA Quotes, Bid-Ask Spreads and Slippage Across Platforms in 2026
Why tokenized NVIDIA (NVDA) spreads and slippage differ by platform: quote sources, matching depth and trading hours, plus a consistent method for recording spreads and slippage.
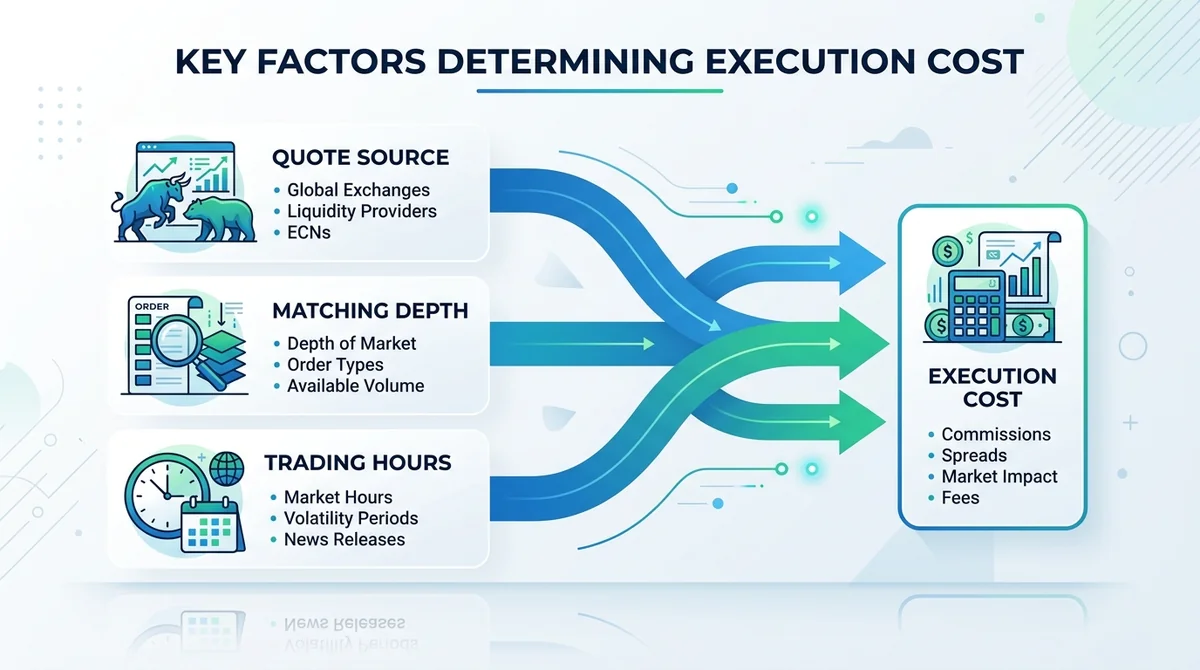
Conclusion: Differences in tokenized NVDA spreads and slippage mainly come from three factors: quote source, matching depth and trading hours. Where public data is missing, bid-ask spreads and slippage should be recorded under a consistent methodology, and items that cannot be verified should be labeled "data not disclosed" rather than replaced with estimates.
#Why do tokenized NVIDIA (NVDA) spreads and slippage differ across platforms?
Differences in tokenized NVDA spreads and slippage mainly come from quote sources, matching depth and trading hours. Token prices track the real US stock price and represent price exposure, not actual share ownership.
#How do quote sources and matching methods affect spreads?
Quotes for tokenized stocks are typically anchored to the real US stock price, but "anchored" does not mean "identical." The update frequency of the quote source, whether multiple upstream market data feeds are connected, and the platform's own matching method (order book matching or bilateral quotes from a quote provider) are all directly reflected in the bid-ask spread.
- Order book matching: The spread is determined by resting order depth; the thinner the depth, the wider the gap between the best bid and best ask.
- Quote-provider driven: The spread is set by the quote provider and is usually more stable, but may widen overall when volatility increases.
A distinction must be made between "genuine spot buying and selling" and "tokenized price exposure": the former involves settlement of actual securities and shareholder status, while the latter only replicates price movements. The spreads and slippage discussed in this article fall within the latter category as trading execution costs.
#How do trading hours and liquidity depth amplify slippage?
Real US stocks have defined trading sessions and market closures, while tokenized products often offer longer, even 24/7, quote windows. During US market closures, upstream prices stop updating, and token quotes can only rely on the market maker's pricing of overnight information; at such times bid-ask spreads typically widen and slippage becomes harder to control.
Liquidity depth determines the ratio of "order size relative to the order book." The higher the proportion a single order represents of the order book, the greater the deviation of the average execution price from the mid price — this is the direct source of slippage.
#What is the relationship between token prices and real US stock prices?
The methodology should be clear: the US stock price is the cause, and the token price is the effect. The token price is a mapping of the real US stock price, and the mapping process involves time lags, premiums or discounts. Therefore, comparing the "price level" across platforms is of limited value; what matters is comparing the "degree of deviation from the same upstream price and the execution cost."
#How should NVDA quotes, bid-ask spreads and slippage be compared across platforms?
Comparing tokenized NVDA across platforms requires a unified dimension table, focusing on quote sources, bid-ask spreads, slippage and liquidity depth; items with missing public information should be labeled as data not disclosed rather than estimated.
#Which dimensions should the comparison table cover?
It is recommended to fix 8–10 dimensions to ensure cross-platform comparability: quote source, quote update frequency, bid-ask spread, slippage, trading hours, minimum order size, fee structure, liquidity depth and data availability.
#How are bid-ask spread and slippage defined and recorded?
- Bid-ask spread: The difference between the best bid and best ask at the same point in time, expressed in absolute terms or as a percentage of the mid price. When recording, the sampling time and whether it falls within US market hours must be noted.
- Slippage: The deviation between the actual average execution price and the reference price at order submission (usually the mid price); the order size must be noted, otherwise slippage across different sizes is not comparable.
A consistent methodology is the core method of this article: only sampling at the same point in time, with the same size and the same session definition has comparative value.
#Which data is missing from public information?
The verifiable public information available did not provide measured spreads, slippage, order book depth or fee figures for each platform, so the relevant items in the table below are uniformly labeled "data not disclosed." This is not an evasion but a way to avoid contaminating comparison conclusions with speculative values.
| Dimension | Tokenized NVDA spot exposure | Real US stock NVDA |
|---|---|---|
| Quote source | Anchored to upstream US stock quotes; specific source data not disclosed | Unified exchange quotes |
| Quote update frequency | Data not disclosed | Tick-by-tick during trading hours |
| Bid-ask spread | Data not disclosed | Determined by order book depth |
| Slippage | Data not disclosed | Determined by order book depth |
| Trading hours | Usually longer than US market hours; specific schedule data not disclosed | Regular US market hours |
| Minimum order size | Data not disclosed | 1 share (some brokers support fractional shares) |
| Fee structure | Data not disclosed | Commissions and regulatory fees, varying by broker |
| Liquidity depth | Data not disclosed | Data not disclosed (varies by instrument and session) |
| Ownership attributes | Price exposure, not shareholder status | Shareholder status and corporate action rights |
| Data availability | Varies by platform disclosure | Public quotes and regulatory disclosures |
Note: This article does not provide a cross-platform ranking of measured values because verifiable same-methodology samples are lacking; any claim that "platform X has the lowest spread" must include the sampling time, order size and session, otherwise it cannot be trusted.
#How should small high-frequency and large low-frequency traders choose respectively?
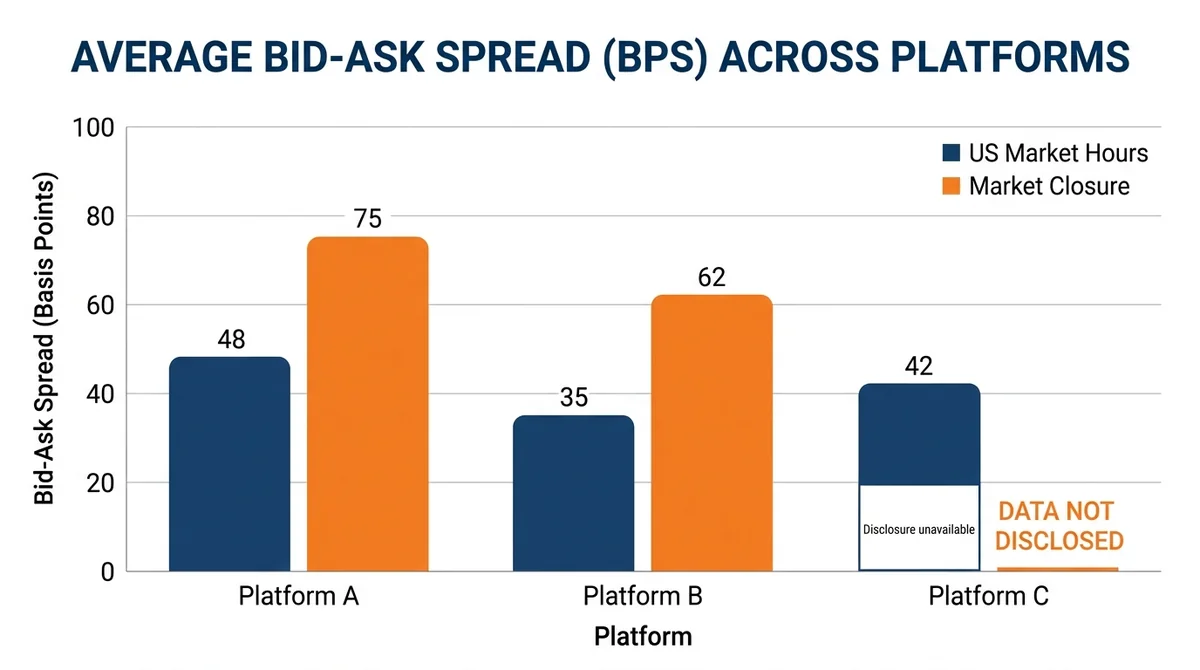
Small high-frequency users should prioritize bid-ask spreads and fixed fees, while large low-frequency users should prioritize liquidity depth and slippage; quote quality during non-US trading hours needs separate evaluation.
#What should spread-sensitive users prioritize?
When the amount per order is small and frequency is high, fixed costs (per-order fees) and bid-ask spreads are the main cost items. Depth has limited impact here because order size is small relative to the order book.
#What should slippage-sensitive users prioritize?
When the amount per order is large and frequency is low, the impact of average execution price deviation far exceeds per-order fixed fees. At this point, order book depth and tiered quotes should be carefully checked, and orders split when necessary.
#What difference do different trading hours make?
If trading mainly occurs during US market closures, the quote update mechanism and spread widening during that session need separate evaluation; performance during US market hours cannot be directly extrapolated.
#Scenario breakdown
- If you are a user with small order sizes and high trading frequency, prioritize bid-ask spreads and per-order fixed fees, then look at depth.
- If you are a user with large order sizes and low trading frequency, prioritize liquidity depth and slippage, and test the execution results of split orders.
- If you mainly trade during US market closures, collect spread samples for that session separately and evaluate overnight quote quality.
- If you need shareholder status and corporate action rights, tokenized exposure does not meet that need, and you should turn to genuine US stock channels.
- If you care about perpetual futures leverage and funding costs, you need to distinguish spot exposure from perpetual structures, as the latter's cost items are entirely different.
#Action checklist
- Determine whether you are small high-frequency or large low-frequency, and identify your primary cost items.
- Sample bid-ask spreads at fixed times and record whether it is within US market hours.
- Test slippage with a fixed order size; do not mix different sizes in comparisons.
- Check the quote source and update frequency disclosed by the platform; record missing items as data not disclosed.
- Check the fee structure and distinguish fixed fees from proportional fees.
- Confirm the trading hours schedule and the handling mechanism during market closures.
- Confirm whether you are trading spot exposure or a perpetual structure, and identify perpetual futures leverage and liquidation risks.
#What risks does tokenized NVDA trading carry besides spreads?
Beyond spreads and slippage, tokenized NVDA also carries tokenization structure risks; if in perpetual form, it also involves perpetual futures leverage and liquidation, and differences in cross-platform data methodology may lead to misjudgment in comparisons.
#How do tokenized stocks differ from real US stocks?
Tokenized stocks provide price exposure and do not necessarily correspond to shareholder status, voting rights and corporate action rights. Holding tokens and holding shares differ in legal relationship and rights ownership, and this should be confirmed before comparing trading costs. In addition, tokenized products involve custody fee and counterparty risks: who issues the token, how the underlying assets are held in custody, and whether there are multisig arrangements or third-party audits all affect the actual reliability of the exposure.
#What additional risks does a perpetual structure bring?
If the product is in perpetual form, it involves how does perpetual futures funding rate work, perpetual futures leverage multiples and forced liquidation mechanisms. These cost items are at a different level from spreads and slippage and cannot be simply combined into a single "total cost" figure for comparison. Funding rates fluctuate with long-short imbalances in the market, and the cost of long-term holding may be significantly higher than the spread itself.
#What misjudgments can inconsistent data methodology cause?
Different platforms may use different methods to measure spreads and slippage (sampling time, reference price definition, whether fees are included). Directly citing self-reported figures from each platform for horizontal comparison can easily lead to wrong conclusions. Re-sampling under a consistent methodology is a necessary correction step.
#Conclusion and disclaimer
The comparison conclusions in this article are only intended to help understand differences in tokenized NVDA spreads and slippage, and do not constitute investment advice or price predictions; data is based on public information.
To check the latest disclosures of specific platforms, see official sources and announcement pages for each platform, and defer to official statements.
This content is compiled from public data and does not constitute investment or open account advice. Data is as of 2026-01-01 and actual conditions may change.
FAQ
Why do tokenized NVDA spreads differ from real US stocks?
Tokenized NVDA quotes are anchored to the real US stock price, but the matching method, quote update frequency and order book depth differ, so bid-ask spreads behave differently. The token price is a mapping of the real US stock price, with time lags and deviations.
How should bid-ask spreads and slippage be recorded to be comparable?
Spreads must note the sampling time and whether it is within US market hours; slippage must note the order size and the reference price definition. Only data at the same point in time, with the same size and the same session definition can be compared horizontally.
Which metric should small high-frequency traders prioritize?
Prioritize bid-ask spreads and per-order fixed fees, because order size is small relative to the order book and depth has limited impact. Then check quote update frequency.
Which metric should large low-frequency traders prioritize?
Prioritize liquidity depth and slippage, and test the execution results of split orders when necessary. Per-order fixed fees usually account for a low proportion in large-size scenarios.
Why does this article not provide specific spread figures for each platform?
The verifiable public information available did not include measured spread, slippage or depth figures for each platform, so they are labeled as data not disclosed under a consistent principle, without estimation, to avoid misleading readers.
Related Terms
Done comparing? Ready to place your first trade?
The crypto assets, tokenized US stocks and ETFs you just compared are all tradable on MSX — spot or perpetuals.
Quick Start Trading →New here? Registration takes three quick steps.