EV/EBITDA Comparison: Pre-IPO vs Public Tech Assets
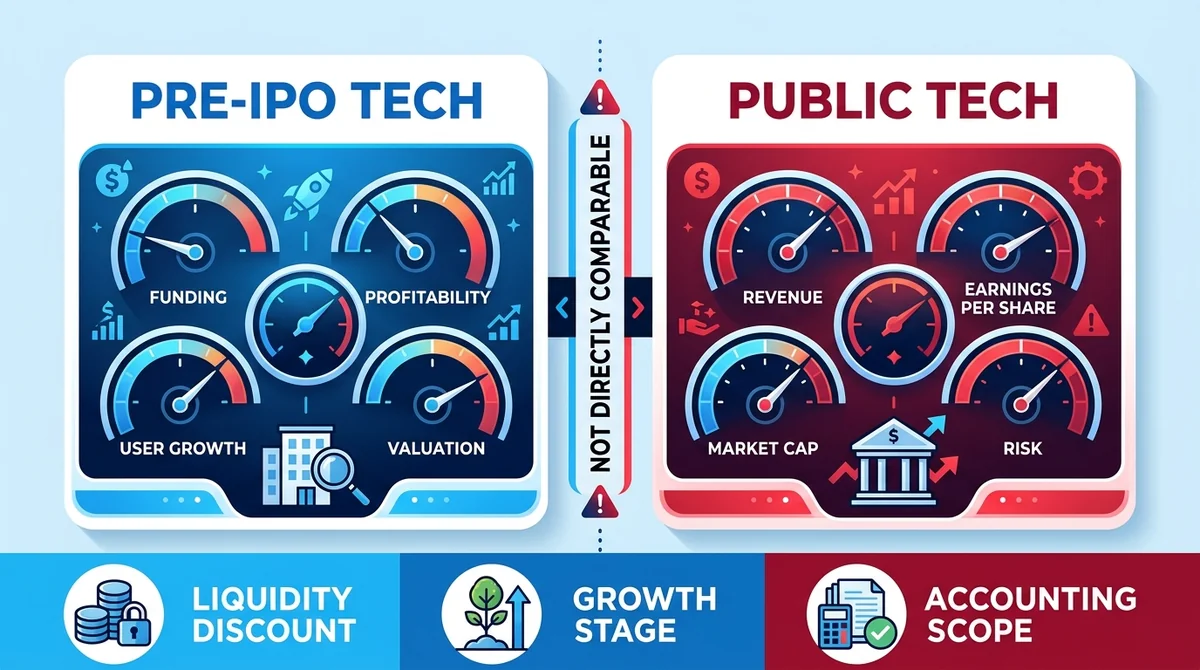
How EV/EBITDA differs between Pre-IPO and public tech assets: calculation scope, comparability limits, adjustments, and how to flag undisclosed data.
#Conclusion: You Cannot Compare the Two Multiples Directly — Align the Scope First, Then Discuss High or Low
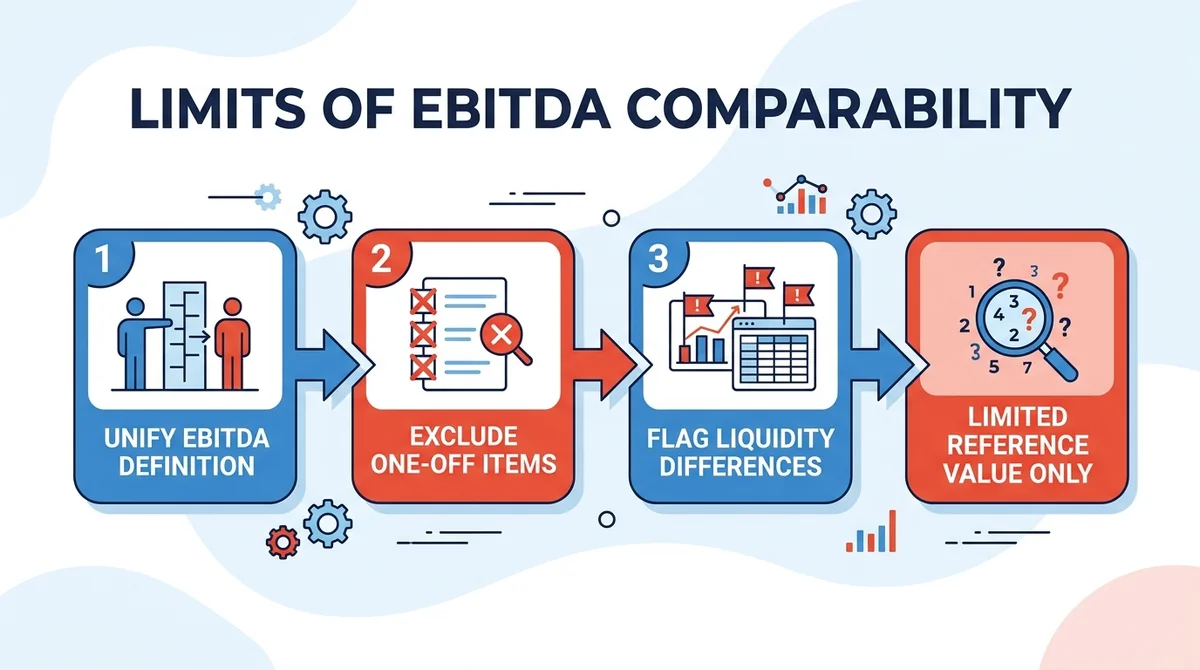
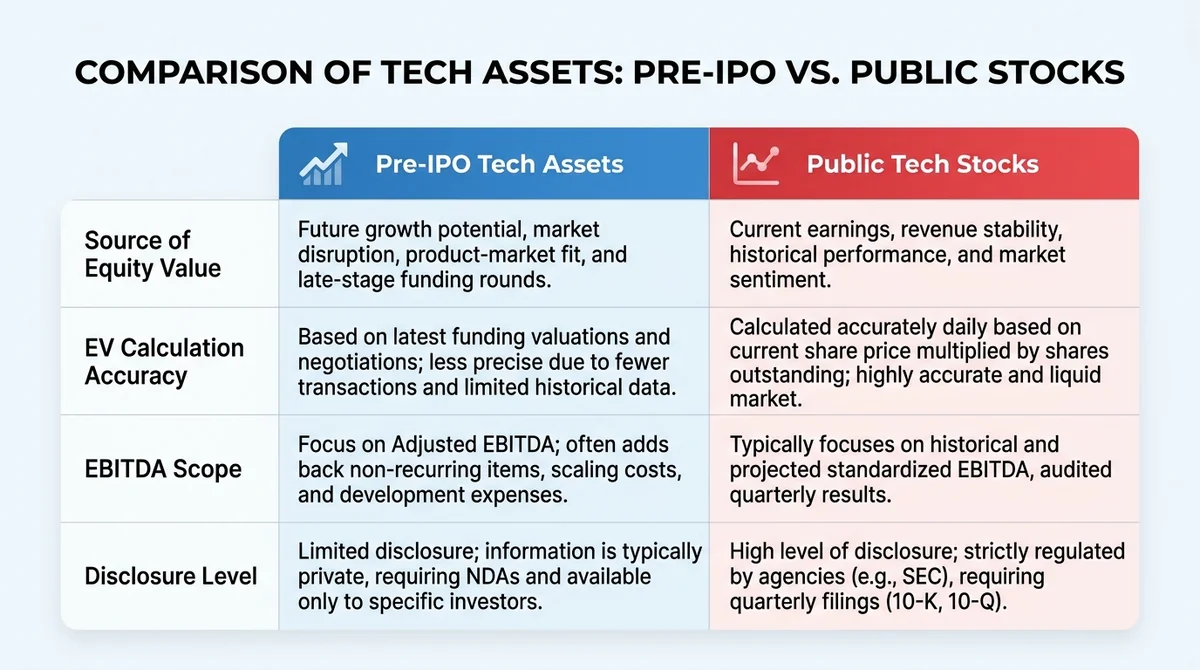
Answer: EV/EBITDA multiples of Pre-IPO tech assets and public tech stocks should not be compared directly — the former's equity value mostly comes from the latest funding round valuation and lacks public quotes, while the latter comes from public market cap; moreover, their EBITDA scopes often differ due to accounting standards and share-based compensation treatment. Only after unifying the EBITDA definition, excluding one-off items, and flagging liquidity differences do the multiples carry limited reference value.
#What does EV/EBITDA actually measure, and why is it often used to compare tech assets?
EV/EBITDA divides enterprise value by earnings before interest, taxes, depreciation, and amortization.
- What EV consists of: equity value + net debt, neutralizing capital structure differences.
- What EBITDA consists of: excludes interest, taxes, depreciation, and amortization — a proxy close to operating cash flow.
- Advantage over P/E: P/E is distorted by perpetual futures leverage and tax rates, while EV/EBITDA is better suited to cross-sectional comparison.
- Applicability boundary: if a tech company's EBITDA is negative or razor-thin, the multiple becomes distorted.
Why it suits cross-capital-structure comparison better than P/E: when two companies carry different debt levels, P/E's denominator (net income) has already been eroded by interest, so part of the multiple gap stems from financing arrangements rather than operating quality; EV/EBITDA neutralizes capital structure on both the numerator and the denominator.
Does it still apply with high growth and low profit?: when current EBITDA is thin, the multiple is mechanically pushed up, and the reading reflects the growth stage more than whether valuation is expensive or cheap; judge it together with the growth rate and margin trajectory.
#How do the EV/EBITDA scopes of Pre-IPO tech assets and public tech stocks differ?
- Source of equity value: public tech stocks use public market cap, verifiable in real time; Pre-IPO assets mostly use the latest funding round valuation, which is not a public quote.
- Accuracy of EV calculation: EV for public stocks is easier to calculate precisely; for Pre-IPO companies, disclosure of net debt details and preferred share structures is limited, and some project data is undisclosed.
- EBITDA scope: affected by accounting standards, share-based compensation treatment, and classification of one-off items — the two are often inconsistent.
- Comparability conclusion: when the scope is not unified, the multiples cannot be compared directly.
#Can the EV/EBITDA multiples of the two asset types be compared directly?
No, they cannot be compared directly. The main distortions come from three places:
- Liquidity discount: Pre-IPO stakes lack continuous quotes and immediate exit channels, so the multiple embeds a discount and does not sit in the same coordinate system as public market multiples.
- Growth stage: primary market targets are often in a phase of revenue expansion with negative or razor-thin profit; the EBITDA base is small and the multiple swings widely.
- Accounting scope: whether share-based compensation is added back and how one-off items are classified can significantly change EBITDA.
Direction of adjustment: unify the EBITDA definition, exclude one-off items, and flag liquidity differences qualitatively; when data is missing, **explicitly state "data undisclosed" and do not speculate. The multiple is for reference only and does not constitute a basis for buying or selling.
#What limitations should you watch for when comparing tech assets with EV/EBITDA?
- The multiple is meaningless when EBITDA is negative: with a negative denominator, neither the sign nor the magnitude of the multiple carries valuation information.
- High-growth companies are easily overvalued or undervalued: low current EBITDA pushes the multiple up, while profit release in the mature phase pushes it down — the reading drifts with the life cycle.
- It does not reflect cash flow quality or capital expenditure intensity: for asset-heavy or R&D-intensive tech companies, the gap between EBITDA and free cash flow can be large.
- It is not a price forecast or investment advice.
#Which asset's EV/EBITDA should you look at for different needs?
- Focusing on public market pricing: look at public tech stocks, where market cap and financial statements are verifiable.
- Wanting to understand primary market valuation logic: look at Pre-IPO assets, focusing on the latest funding round valuation and terms.
- Using both together: unify the scope first, then compare, and flag liquidity differences separately.
- Clarify the purpose before choosing the target: the purpose of the comparison determines the data source, not the other way around.
#Scenario routing
- If you are a public market trader who needs to judge whether a tech stock is expensive relative to peers, use same-scope multiples of public tech stocks as the benchmark.
- If you are studying primary market pricing and want to understand the valuation logic of a Pre-IPO target, look at its latest funding round valuation and EBITDA scope notes, and honestly flag where data is undisclosed.
- If you are making allocation decisions across both markets, first unify the EBITDA definition and exclude one-off items, then layer on a qualitative judgment of the liquidity discount.
- If you face a target with negative EBITDA, abandon this multiple and switch to revenue multiples or cash flow metrics.
#Action checklist
- Confirm the source of the target's equity value: public market cap or latest funding round valuation.
- Check whether net debt details are available, and mark missing items as "data undisclosed".
- Unify the EBITDA definition: whether share-based compensation and one-off items are added back.
- Check whether EBITDA is positive and has reasonable thickness.
- Flag liquidity differences qualitatively; do not quantify the discount.
- Record the data cutoff date to avoid comparing an old valuation with a new market cap.
#FAQ
Q1: Is the EV/EBITDA multiple of Pre-IPO assets usually higher or lower than that of public stocks? A: There is no unified conclusion. The level of the multiple depends on the target's growth stage, EBITDA thickness, and the valuation scope used; moreover, Pre-IPO equity value mostly comes from non-public funding valuations and does not sit in the same coordinate system as public market cap, so a direct high-or-low comparison is inappropriate.
Q2: What should you do when EBITDA is negative? A: The multiple loses its meaning; switch to revenue multiples, gross profit multiples, or cash flow metrics, and clearly explain in the analysis why EV/EBITDA was abandoned.
Q3: Should share-based compensation be added back to EBITDA? A: It depends on the scope chosen. Adding it back raises EBITDA and lowers the multiple; not adding it back is closer to the true cost. The key is that both sides of the comparison use the same treatment, otherwise part of the multiple gap stems from scope rather than operations.
Q4: Why is EV for public tech stocks easier to calculate precisely? A: Because equity value comes from public market cap, verifiable in real time, and net debt can be obtained from periodic financial statements — both components have verifiable data sources; for Pre-IPO companies, disclosure of net debt and preferred share structures is limited.
Q5: Can this multiple replace cash flow analysis? A: No. EBITDA does not reflect capital expenditure intensity or changes in working capital, and can differ substantially from free cash flow; it is only one reference dimension of relative valuation.
This content is a methodology explanation and does not constitute investment or open account advice. No specific company multiples or financial data are cited here; for specific targets, refer to the company's announcements, prospectus, or periodic financial statements, and honestly flag where data is undisclosed.
FAQ
Is the EV/EBITDA multiple of Pre-IPO assets usually higher or lower than that of public stocks?
There is no unified conclusion. The level of the multiple depends on the target's growth stage, EBITDA thickness, and the valuation scope used; moreover, Pre-IPO equity value mostly comes from non-public funding valuations and does not sit in the same coordinate system as public market cap, so a direct high-or-low comparison is inappropriate.
What should you do when EBITDA is negative?
The multiple loses its meaning; switch to revenue multiples, gross profit multiples, or cash flow metrics, and clearly explain in the analysis why EV/EBITDA was abandoned.
Should share-based compensation be added back to EBITDA?
It depends on the scope chosen. Adding it back raises EBITDA and lowers the multiple; not adding it back is closer to the true cost. The key is that both sides of the comparison use the same treatment, otherwise part of the multiple gap stems from scope rather than operations.
Why is EV for public tech stocks easier to calculate precisely?
Because equity value comes from public market cap, verifiable in real time, and net debt can be obtained from periodic financial statements — both components have verifiable data sources; for Pre-IPO companies, disclosure of net debt and preferred share structures is limited.
Can this multiple replace cash flow analysis?
No. EBITDA does not reflect capital expenditure intensity or changes in working capital, and can differ substantially from free cash flow; it is only one reference dimension of relative valuation.
Done comparing? Ready to place your first trade?
The crypto assets, tokenized US stocks and ETFs you just compared are all tradable on MSX — spot or perpetuals.
Quick Start Trading →New here? Registration takes three quick steps.