Beyond Intel vs TSMC: A Three-Way Comparison of Memory and Foundry Cross-Exposure in 2026 (Micron, SK Hynix, TSMC)
2026 three-way comparison of Micron, SK Hynix, and TSMC: business mix, cycle sensitivity, HBM and advanced packaging roles, customer and geographic exposure, plus how tokenized stocks and perpetuals differ.
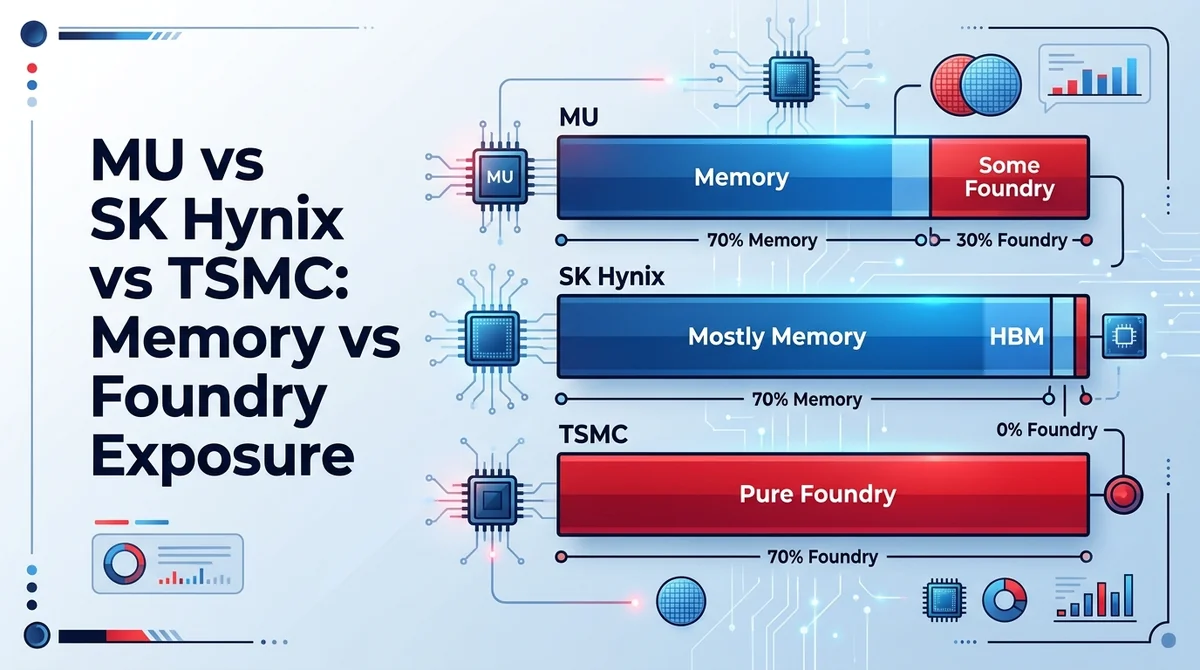
Conclusion: The key difference among the three is not "who is stronger" but the exposure structure — MU has a blended exposure of memory plus some foundry business, SK Hynix is more concentrated in memory and HBM, and TSMC is pure foundry exposure. First decide which cycle you want exposure to, then decide which one to watch.
#What exactly is the difference in business exposure among Micron, SK Hynix, and TSMC?
Exposure refers to how sensitive a company's revenue and profit are to a given industry cycle. Although all three companies are in semiconductors, their revenue drivers are not the same.
MU: A blended exposure of memory plus some foundry business. The majority of its revenue comes from memory products, while it also has some foundry-related business, so it is affected by both the memory price cycle and the foundry capacity cadence. Specific revenue split ratios are not publicly disclosed (refer to the company's periodic filings).
SK Hynix: Viewed as a purer memory and HBM play. Revenue is concentrated in memory product lines, and the role of HBM in its revenue mix rises with AI server demand; specific percentage data is not publicly disclosed.
TSMC: The representative of pure foundry exposure. Revenue comes from providing wafer manufacturing services to customers, driven by capacity utilization and process node advancement rather than memory prices.
Cross-exposure is defined as: a company simultaneously exposed to both the memory and foundry cycles. MU is structurally the closest of the three to this description.
#How do the driving logics of the memory cycle and the foundry cycle differ?
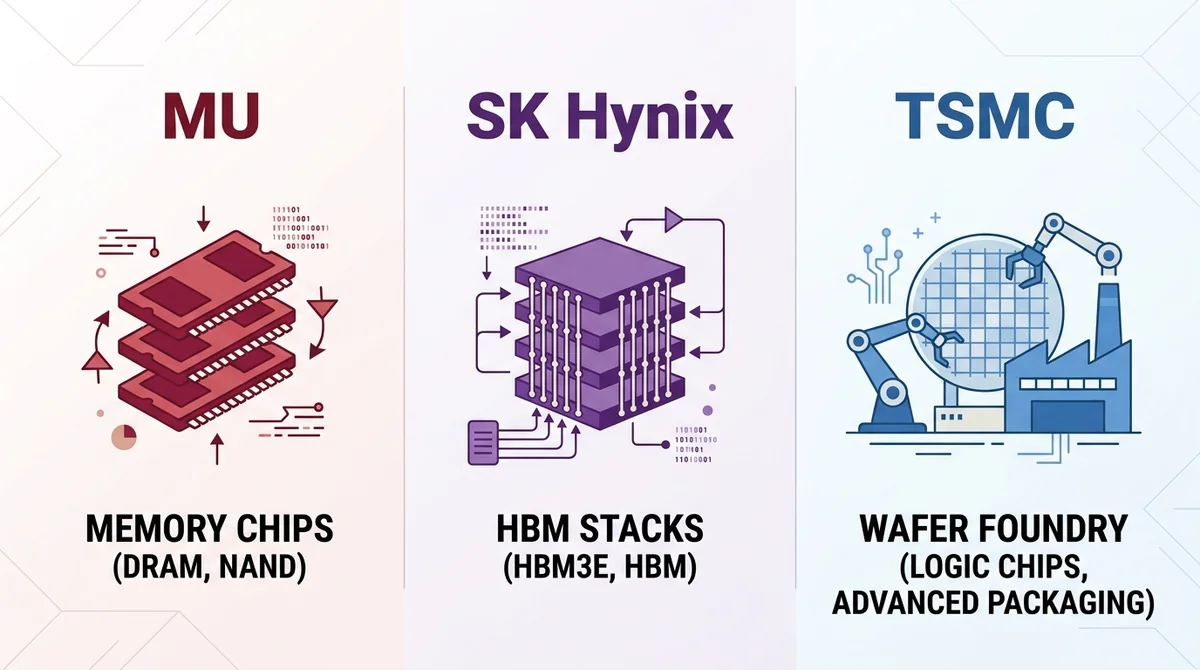
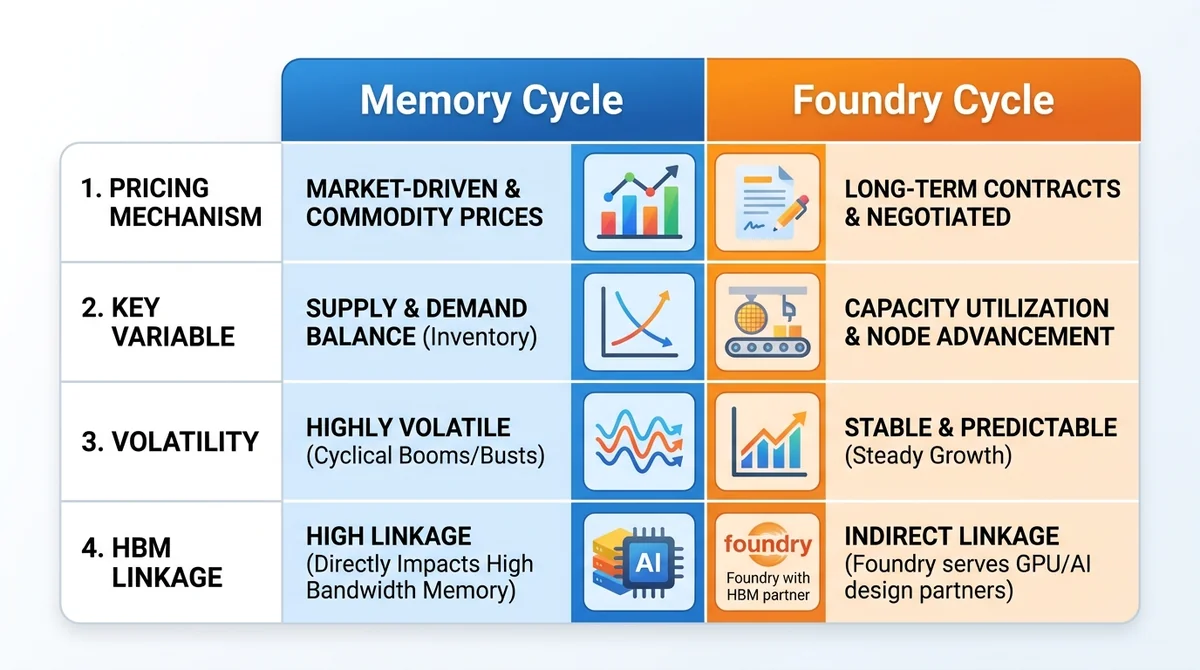
Why is the memory business highly cyclical? Memory products are highly standardized, so supply-demand gaps are directly reflected in prices, and price fluctuations pass through to revenue and gross margin, resulting in high cyclical elasticity.
What sustains foundry capacity utilization? Foundry relies on customer orders and process node competitiveness; capacity utilization and node ramp cadence are the core variables, and prices are usually set through long-term agreements, so short-term volatility is smaller than in memory.
How does HBM link the two lines? HBM is a memory product, but its mass production depends on advanced packaging and foundry collaboration, so HBM strength affects both memory makers and the advanced packaging foundry segment.
The diversification effect of the two cycles being out of sync: When memory prices decline while foundry capacity remains tight, a blended-exposure company's revenue volatility may be smaller than that of a pure memory play, but this also means its upside elasticity is relatively diluted during upcycles.
#Three-way comparison: item-by-item across 8–10 dimensions
| Dimension | MU | SK Hynix | TSMC |
|---|---|---|---|
| Business structure | Primarily memory + some foundry business | Concentrated in memory product lines | Pure foundry manufacturing services |
| Revenue source | Mainly memory product sales | Mainly memory product sales | Wafer foundry service fees |
| Cycle sensitivity | Medium-high (two cycles combined) | High (memory prices pass through directly) | Medium (driven by capacity utilization and nodes) |
| HBM participation | Participates; percentage data not disclosed | Viewed as a core HBM play; percentage data not disclosed | Participates indirectly through advanced packaging and foundry collaboration |
| Advanced packaging | Data not disclosed | Data not disclosed | Advanced packaging is one of the capacity directions it emphasizes externally |
| Customer structure | Data not disclosed | Data not disclosed | Mainly external chip design customers; specific list not disclosed |
| Geographic exposure | Data not disclosed | Data not disclosed | Data not disclosed |
| Capex intensity | Data not disclosed | Data not disclosed | Data not disclosed |
| Technology node | Memory process | Memory process + HBM stacking | Logic process node advancement |
| Main risk factors | Memory price decline + foundry business volatility | Memory price decline, HBM competition | Declining capacity utilization, customer concentration |
Note: Items marked "data not disclosed" in the table above mean that the publicly verifiable data available for this piece does not include the corresponding quantitative metric; it does not mean the company has not disclosed it. Refer to each company's periodic reports for specifics.
#Dimension details
Business structure determines how many cycles you are buying a combination of. MU is two cycles; SK Hynix is one (memory); TSMC is one (foundry).
Cycle sensitivity is not better when higher. High sensitivity means greater upside elasticity but also greater downside drawdown; a blended exposure usually has a smoother volatility path.
HBM participation requires distinguishing "participation" from "revenue share." The three occupy different positions in the HBM chain: memory makers supply products, while foundries provide manufacturing and packaging collaboration, but specific percentage data is not publicly disclosed for any of them, so it is inappropriate to draw conclusions from a single number.
Customer and geographic exposure directly affects the impact magnitude of a single customer cutting orders. In the verifiable data for this piece, none of the three provided a complete customer list or geographic revenue breakdown, so no quantitative ranking is made.
Capex intensity determines cash flow pressure during a downcycle. All three are asset-heavy models, but specific capex-to-revenue ratios are not publicly disclosed.
Technology nodes cannot be directly compared across categories: memory processes and logic processes use different naming systems, and HBM adds stacking layer counts and packaging processes, so comparing node numbers across categories is meaningless.
#When should you focus on memory exposure, and when on foundry exposure?
If you want to bet on rising memory prices and HBM demand and can tolerate greater volatility, prioritize researching concentrated memory plays like SK Hynix.
If you want to bet on advanced processes and foundry capacity utilization and value greater customer diversification, prioritize researching pure foundry plays like TSMC.
If you want to cover both cycles at once without overly concentrated exposure, look at MU's blended structure, but accept that upside elasticity is diluted.
If you only want to observe the industry chain rather than judge a single company, you can track all three side by side and cross-validate using two sets of indicators: memory prices and foundry capacity utilization.
If you are expressing the above exposures through tokenized stocks or perpetual futures, you must first read the next section to understand the difference between price exposure and shareholder status.
#What should you watch out for when expressing these exposures with tokenized stocks or perpetual futures?
Are tokenized stocks the same as real US stocks? No. Tokenized stocks provide price exposure and do not constitute real shareholding; shareholder status, corporate actions, and dividend treatment differ from direct shareholding.
Where does the risk of tokenized stock perpetuals lie? Perpetuals are derivatives and further removed from real stocks: they add funding rates and liquidation mechanisms, perpetual futures leverage amplifies volatility, and forced liquidation is possible in extreme markets.
What is the relationship between US stock prices and token prices? US stock prices are the cause, and token prices are the effect. Token prices track the underlying price but may deviate due to liquidity, premiums/discounts, and platform mechanisms.
Leverage and liquidation risk: When using perpetuals to express exposure, the underlying itself is already highly cyclical, and adding perpetual futures leverage significantly raises the probability of liquidation.
#Risk warning and disclaimer
This article only provides an objective comparison of business structure and exposure dimensions; it does not provide price forecasts and does not constitute any buy or sell recommendation. The semiconductor industry faces downcycle, price volatility, technology route changes, and geopolitical policy risks; derivatives carry liquidation risk. To verify the latest disclosure metrics, see each company's investor relations pages and official sources.
This content is compiled from public data and does not constitute investment or open account advice. Data is as of 2026-01-01 and actual conditions may change.
FAQ
What is the core difference between Micron and SK Hynix?
MU has a blended exposure of memory plus some foundry business, so it is affected by both the memory price cycle and foundry cadence; SK Hynix is more concentrated in memory product lines and HBM, with purer exposure and greater volatility elasticity. Specific revenue split ratios are not publicly disclosed.
Why is TSMC called pure foundry exposure?
Because its revenue comes from providing wafer manufacturing services to customers, driven by capacity utilization and process node advancement rather than memory product prices, so it does not directly bear memory cycle risk.
Why does HBM affect both the memory and foundry lines?
HBM itself is a memory product, but its mass production depends on advanced packaging and foundry collaboration, so HBM strength affects both memory makers and the advanced packaging foundry segment.
Are tokenized stocks the same as directly buying US stocks?
No. Tokenized stocks provide price exposure and do not constitute real shareholding; they differ from direct shareholding in shareholder status, corporate actions, and dividend treatment.
What is the main risk of expressing semiconductor exposure with perpetual futures?
Perpetuals are derivatives that add funding rates and liquidation mechanisms; perpetual futures leverage amplifies the underlying's cyclical volatility, and forced liquidation risk exists in extreme markets.
Related Terms
Done comparing? Ready to place your first trade?
The crypto assets, tokenized US stocks and ETFs you just compared are all tradable on MSX — spot or perpetuals.
Quick Start Trading →New here? Registration takes three quick steps.