NVDA vs AMD PE Ratio: Valuation Multiples and Comparison (2026)
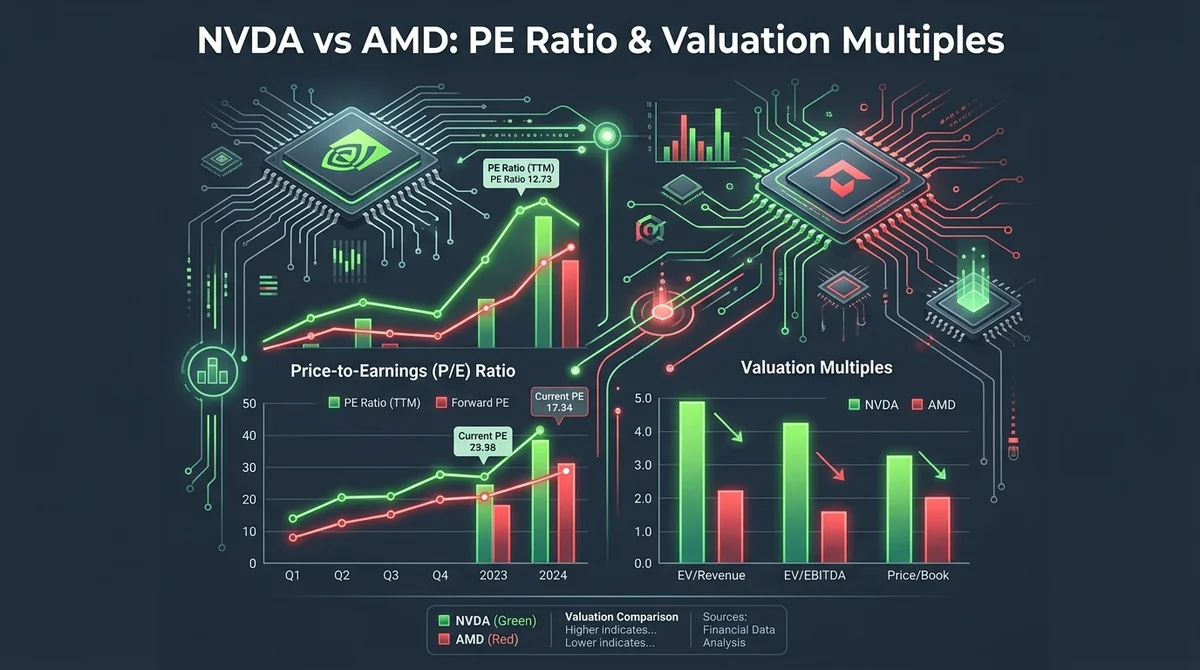
Compare NVDA vs AMD PE ratios to evaluate trailing multiples, forward growth, and margins. Analyze which semiconductor asset fits your portfolio model in 2026.
The difference between the NVDA and AMD PE ratio reflects how markets price AI data center dominance against broad-based semiconductor diversification. While NVIDIA's price-to-earnings multiple is supported by higher operating margins and enterprise AI compute demand, AMD's PE ratio balances cyclical client PC, gaming console, and embedded hardware exposure alongside its accelerator growth.
#Key Takeaways
- Trailing PE evaluates past earnings performance, whereas forward PE prices consensus growth expectations and infrastructure demand.
- NVIDIA commands valuation premiums driven by enterprise compute margins, while AMD blends enterprise GPU upside with consumer CPU and gaming cycles.
- Evaluating the PEG ratio alongside EV/EBITDA provides a clearer, growth-adjusted picture than relying solely on trailing PE ratios.
- Asset allocation between NVDA and AMD depends on balancing high-multiple pure-play AI exposure against diversified chip architectures.
#What Is the Difference Between NVDA and AMD PE Ratios?
The primary difference between the nvda vs amd pe ratio lies in how capital markets value differing revenue compositions and margin profiles across enterprise compute cycles. The price-to-earnings multiple serves as a benchmark for what investors are willing to pay per dollar of net income generated by each chipmaker.
Comparing NVDA and AMD PE ratios highlights how equity markets price structural AI data center expansion against broad-market semiconductor exposure. While trailing PE captures historical net income, forward PE ratios reflect consensus earnings growth across accelerator chip cycles. Investors evaluating semiconductor assets must assess these multiples relative to capital expenditure durability across hyperscale cloud providers rather than relying exclusively on unadjusted historical earnings.
#Trailing PE vs Forward PE for NVIDIA and AMD
- Trailing Price-to-Earnings (TTM PE): Measures the current share price against reported earnings over the preceding 12 months. In rapid acceleration cycles, trailing multiples can appear elevated before recent revenue gains fully materialize in net income.
- Forward Price-to-Earnings (Forward PE): Uses consensus Wall Street analyst estimates for future fiscal year earnings. When comparing AMD vs NVDA stock analysis, forward multiples offer a clearer view of expected growth trajectories.
#Key Drivers Behind Semiconductor Valuation Multiples
Semiconductor multiples fluctuate based on three core structural drivers:
- Product Refresh Cadence: Architecture upgrades across data center GPUs and enterprise CPUs drive gross margin expansion.
- Enterprise Cloud Spending: Hyperscaler capital expenditures directly influence forward earnings revisions.
- Supply Chain Dynamics: Advanced packaging and foundry allocations determine unit delivery capabilities and multiple sustainability.
#How Do Revenue Growth and Margins Affect NVDA vs AMD PE Multiples?
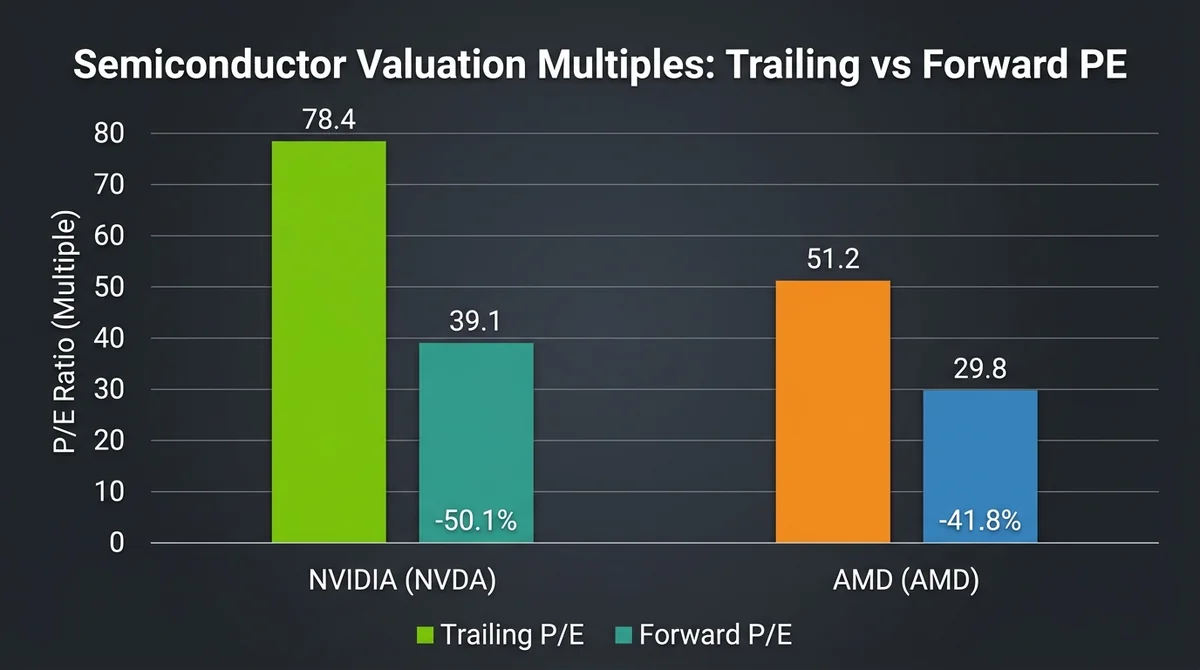
Revenue growth velocity and segment operating margins are the primary determinants of divergence in the nvidia vs amd pe ratio. Higher-margin product lines allow a company to convert top-line expansion into bottom-line earnings at a higher rate, supporting elevated valuation multiples.
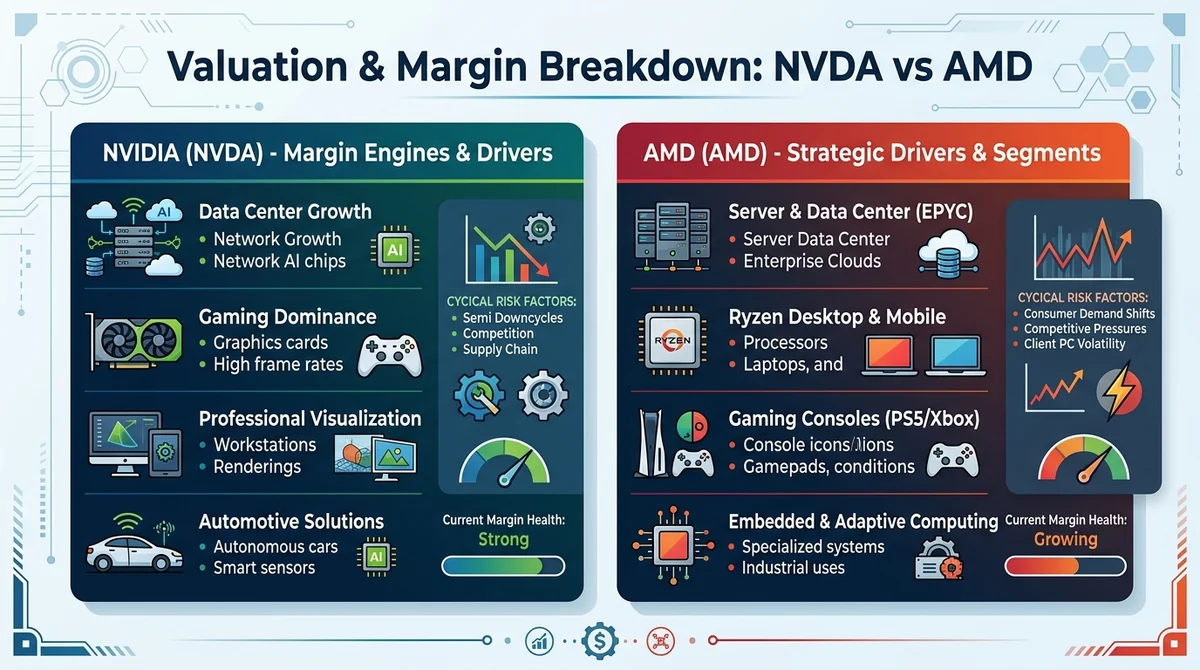
| Valuation & Financial Factor | NVIDIA (NVDA) Focus | AMD (AMD) Focus |
|---|---|---|
| Core Margin Engine | Enterprise AI accelerators & compute clusters | Enterprise EPYC CPUs & Instinct accelerators |
| Cyclical Exposure | High concentration in data center infrastructure | Balanced exposure across client PCs, consoles, and FPGAs |
| Multiple Expansion Driver | High software moat and full-stack enterprise computing | Market share gains in x86 servers and expanding AI portfolio |
| Key Downside Risk | Hyperscaler capex digestion or concentration risk | Consumer hardware cyclicality and margin dilution |
#AI Accelerator Demand and Data Center Margins
Enterprise compute hardware commanding high gross margins provides strong foundational support for NVIDIA's valuation multiples. When evaluating peers like in our Nvidia vs AMD vs Broadcom comparison, high gross margins on accelerated computing platforms shield overall earnings from broader hardware cyclicality.
#Client PC, Gaming, and Embedded Segment Exposure
AMD's business model encompasses a broader hardware footprint, including desktop processors, semi-custom gaming console SoCs, and adaptive computing hardware from its Xilinx integration. While this diversification offers resilience against enterprise-specific downturns, lower operating margins in consumer-facing lines impact blended net income and compress the trailing nvda vs amd pe relative multiple.
#Which Additional Valuation Metrics Should Be Used Alongside PE Ratio?
Relying exclusively on the standard PE ratio can obscure important financial details regarding capital structure and growth rates.
Evaluating the NVDA vs AMD PE ratio in isolation often obscures underlying earnings quality, making supplementary metrics like the PEG ratio and EV/EBITDA indispensable. The price/earnings-to-growth ratio adjusts raw multiples by projected EPS expansion, while enterprise value metrics remove capital structure differences. Integrating these multi-factor valuation tools enables capital allocators to determine whether elevated semiconductor multiples are genuinely justified by cash flow generation.
#PEG Ratio for Growth-Adjusted Valuation
The Price/Earnings-to-Growth (PEG) ratio normalizes the traditional PE multiple by dividing it by expected annual earnings growth. A company trading at a high PE multiple may demonstrate a competitive PEG ratio if its underlying earnings expand at a rapid rate, making it comparable to alternatives on our stocks similar to NVDA list.
#Price-to-Sales (P/S) and Enterprise Value Multiples (EV/EBITDA)
- Price-to-Sales (P/S): Useful for comparing top-line valuation before accounting for differing operating expense structures.
- Enterprise Value to EBITDA (EV/EBITDA): Accounts for debt, cash holdings, and non-cash depreciation expenses, offering an operational comparison between hardware providers such as in the Nvidia vs Micron analysis.
#How to Evaluate NVDA vs AMD for Asset Allocation Decisions?
Evaluating NVDA and AMD for portfolio allocation requires balancing secular AI infrastructure momentum against broader hardware diversification.
                    Valuation Allocation Framework
                                  │
         ┌────────────────────────┴────────────────────────┐
         ▼                                                 ▼
High AI Data Center Exposure                   Diversified Architecture Exposure
  • Premium forward multiples                    • Balanced multi-segment revenue
  • High operating margins                       • Cyclical consumer & PC cushion
  • Hyperscaler concentration                    • Competitive server CPU market share
         │                                                 │
         ▼                                                 ▼
   NVIDIA (NVDA)                                       AMD (AMD)
#Evaluating Cyclical Risk vs Secular Growth Drivers
- Secular AI Infrastructure Growth: High data center compute demand supports multiple sustainability for specialized market leaders.
- Cyclical Semiconductor Volatility: Macro enterprise spending freezes or inventory adjustments historically lead to multiple compression across the semiconductor index.
#Decision Framework for Semiconductor Asset Selection
- Growth Profile Matching: Investors seeking pure-play exposure to high-margin accelerated computing may accept higher multiple premiums.
- Downside Cushioning: Those seeking exposure to enterprise servers, PC refreshes, and embedded systems often favor diversified product lines.
- Multiple Sensitivity: Track PEG ratios over trailing PE multiples to ensure valuation expansion remains supported by projected earnings delivery.
Disclaimer: This comparison is for informational and analytical purposes only and does not constitute financial, investment, or trading advice. Past performance and multiple valuations do not guarantee future results.
FAQ
What does a higher forward PE ratio indicate when comparing NVDA and AMD?
A higher forward PE ratio indicates that the market expects stronger future earnings growth, higher gross margins, or durable competitive moats in key product segments.
Why do semiconductor PE multiples fluctuate significantly across quarters?
Semiconductor valuation multiples fluctuate due to cyclical hardware refresh cycles, shifts in enterprise data center capital expenditures, and inventory adjustments across global supply chains.
Is the PEG ratio better than the PE ratio for evaluating semiconductor stocks?
Yes, the PEG ratio is often more informative because it adjusts the standard PE multiple for consensus earnings growth rates, preventing high-growth chipmakers from appearing deceptively expensive.
How do gaming and PC segments affect AMD's valuation compared to NVDA?
AMD's exposure to cyclical consumer PC processors and semi-custom gaming console chips creates a blended margin profile, which can moderate its overall valuation multiple relative to enterprise compute leaders.
Related Terms
Done comparing? Ready to place your first trade?
The crypto assets, tokenized US stocks and ETFs you just compared are all tradable on MSX — spot or perpetuals.
Quick Start Trading →New here? Registration takes three quick steps.