SK hynix vs Micron Comparison Extended: Beyond HBM in 2026, Ranking Three-Way Exposure to Traditional DRAM and NAND Cycles (Samsung and Kioxia Join the Picture)
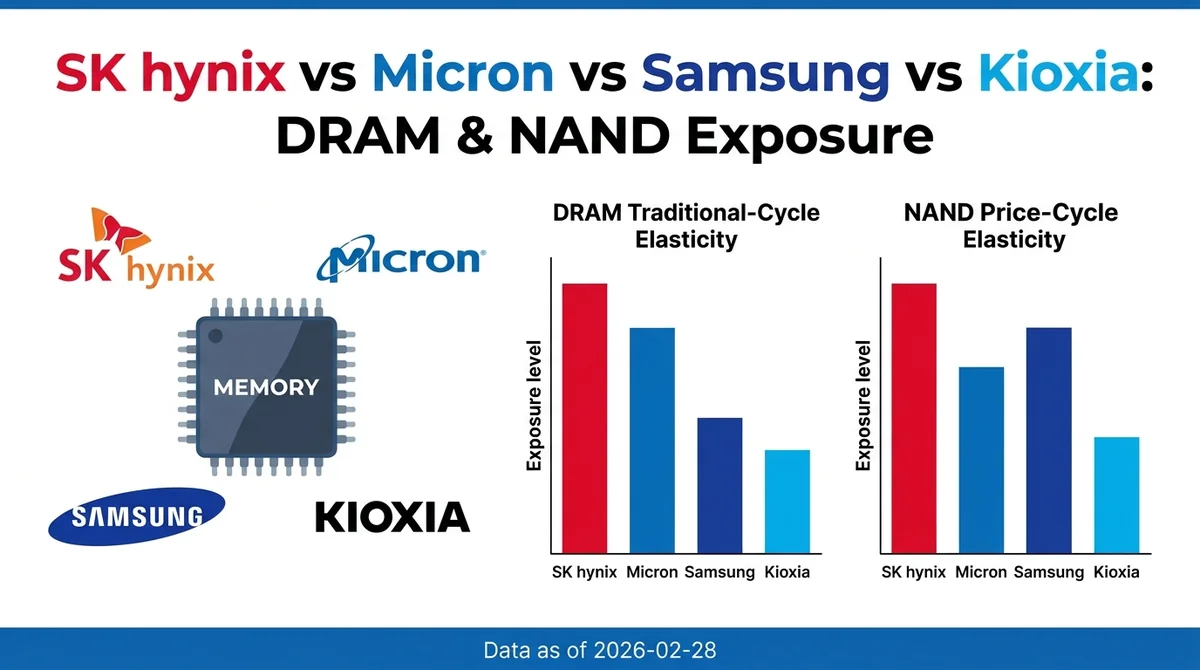
A structural comparison of SK hynix, Micron, Samsung, and Kioxia exposure to traditional DRAM and NAND cycles beyond HBM, and how to pick the right comparison.
Bottom line: If you look only at the traditional memory cycles beyond HBM, there is no single answer to the exposure ranking. By DRAM traditional-cycle elasticity, Samsung and SK hynix have the most concentrated DRAM exposure, MU comes next, and Kioxia is essentially absent. By NAND price-cycle elasticity, Kioxia is close to a pure NAND exposure, MU comes next, and Samsung and SK hynix are relatively diversified. When choosing a comparison target, first confirm which cycle you are actually worried about.
Data as of 2026-02-28. This article is a structural, qualitative comparison. Specific revenue-share and market-share figures have not been item-by-item verified, and nothing here constitutes investment advice or a recommendation to open account.
Terminology note: "Exposure" in this article refers to the sensitivity structure of a company's business revenue to a given price cycle (the traditional DRAM cycle or the NAND price cycle). It does not mean position exposure, trading exposure, or currency exposure.
#Why are the traditional DRAM and NAND cycles beyond HBM still worth watching separately?
Traditional DRAM and NAND still amplify the cyclical swings of memory makers, and the two cycles are not synchronized, so they must be assessed separately. HBM is only one part of the incremental narrative and cannot replace observation of the traditional cycles.
How HBM capacity crowding transmits to traditional DRAM: HBM and DRAM compete for production capacity, so a rising HBM share may squeeze traditional DRAM supply. But the direction and magnitude of this transmission depend on each maker's capacity allocation, inventory levels, and product mix. This page describes structure only and makes no price forecasts.
Why the NAND price cycle and the DRAM cycle are not synchronized: The DRAM cycle is generally seen as driven by capacity and inventory, while the NAND cycle is more affected by consumer electronics demand and the pace of producer output cuts. Because the two cycles are not synchronized, the same company's exposure can diverge across quarters.
#What are the key differences between SK hynix and MU in DRAM and NAND exposure?
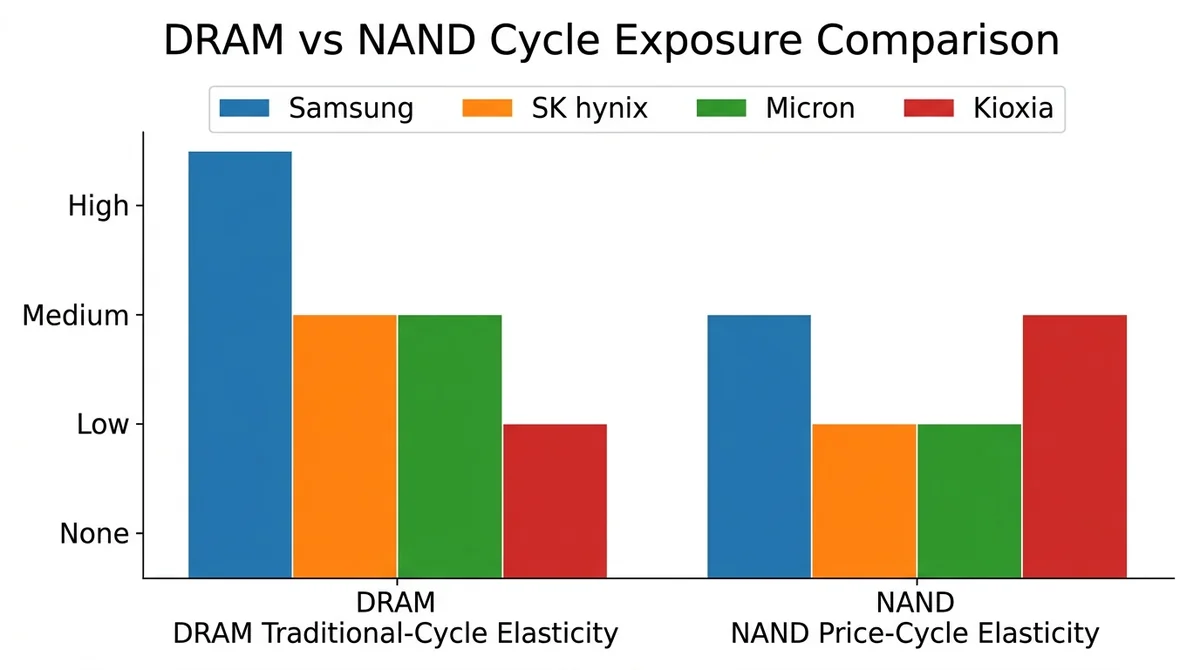
SK hynix has a more DRAM-centric, single-core exposure, while MU is balanced across DRAM and NAND, so their sensitivity differs across cycle phases.
Where the two business structures differ: SK hynix is centered on DRAM (including HBM), while MU is balanced across DRAM and NAND. Specific revenue-share and market-share figures have not been item-by-item verified against a stated methodology, so this page offers only a structural comparison and cites no unsourced numbers.
Does HBM leadership mean leadership in traditional DRAM too?: No. HBM technology leadership and leadership in traditional DRAM cost and share are different competitive dimensions and cannot be directly equated.
What role does NAND play at each company?: NAND carries a relatively higher revenue weight for MU, while for SK hynix it is more of a complementary role. This judgment is based on general understanding of the business structures; specific proportions have not been publicly verified.
#How should the three-way exposure ranking be ordered once Samsung and Kioxia are included?
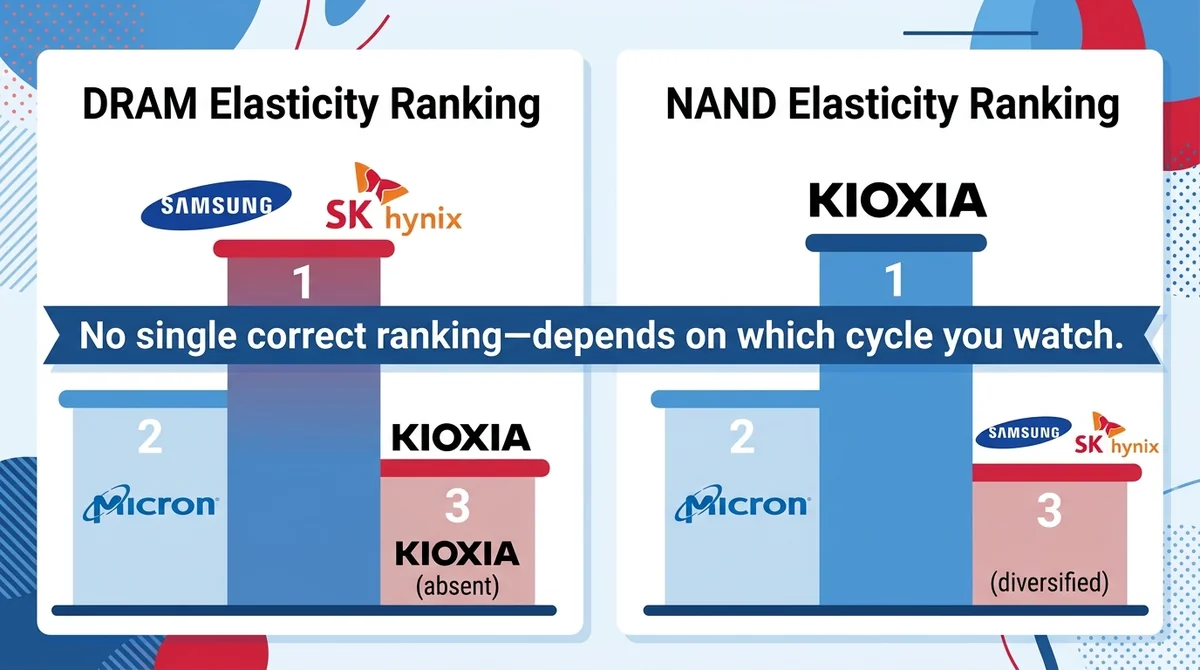
By DRAM traditional-cycle elasticity: Samsung and SK hynix are tied at the top, MU comes next, and Kioxia is essentially absent. By NAND price-cycle elasticity: Kioxia, close to a pure NAND exposure, ranks first, MU comes next, and Samsung and SK hynix are relatively diversified.
Ranking by DRAM traditional-cycle elasticity: Samsung and SK hynix have the most concentrated DRAM exposure, MU comes next, and Kioxia is essentially absent.
Ranking by NAND price-cycle elasticity: Kioxia is close to a pure NAND exposure, MU comes next, and Samsung and SK hynix are relatively diversified.
Why there is no single correct ranking: The ranking depends on which cycle you are watching, not on the absolute superiority of any company. This page only ranks exposure structures and offers no buy/sell advice or price forecasts.
Exposure structure comparison matrix (qualitative)
| Name | Traditional DRAM cycle exposure | NAND price cycle exposure | Structural characteristics |
|---|---|---|---|
| Samsung | High (concentrated) | Medium (relatively diversified) | Covers both DRAM and NAND, with DRAM weighted more heavily |
| SK hynix | High (concentrated, including HBM) | Low (complementary role) | DRAM single-core structure |
| MU | Medium | Medium-high | Balanced across DRAM and NAND, usable as an intersection reference |
| Kioxia | Essentially absent | High (close to pure NAND) | Single NAND exposure structure |
Note: The matrix is a structural, qualitative judgment and cites no item-by-item verified revenue-share or market-share figures.
#How should people with different focuses choose a comparison target?
The rule for choosing a comparison target is straightforward: if you are worried about the traditional DRAM cycle, look at SK hynix and Samsung; if you are worried about the NAND price cycle, look at Kioxia and MU; if you want to cover both cycles, use MU as the intersection reference.
- If you care only about the traditional DRAM cycle, prioritize SK hynix vs Samsung.
- If you care only about the NAND price cycle, prioritize Kioxia vs MU.
- If you want to cover both cycles, use MU as the intersection reference for DRAM and NAND.
- If you only want the HBM incremental story, this page does not apply; go back to the HBM topic comparison page.
#What limitations and risks come with using exposure rankings to make judgments?
Exposure rankings only indicate which cycle a company is more sensitive to. They neither predict cycle direction nor constitute any investment advice.
Why exposure structure does not equal business results: Exposure structure describes sensitivity only; it does not predict cycle direction or magnitude. Capacity expansion, inventory, customer structure, product mix, and exchange rates can all change the actual transmission.
What this page does not cover: This page provides no price forecasts and does not constitute investment advice. It makes no inferences about specific financial or market-share data that have not been item-by-item verified.
This content is compiled from public information and general industry understanding and does not constitute investment advice or a recommendation to open account. The structural judgments here have not been verified item by item and actual conditions may change.
To verify related data, consult each company's investor relations pages and financial reports directly:
- SK hynix investor relations: https://www.skhynix.com/ir/UI-FR-IRMAIN
- Micron investor relations: https://investors.micron.com/
- Samsung Electronics investor relations: https://www.samsung.com/global/ir/
- Kioxia investor relations: https://www.kioxia-holdings.com/en-jp/ir.html
Further reading: the on-site "HBM topic comparison page" offers a comparison of manufacturers from the HBM incremental perspective.
FAQ
Beyond HBM, why should the traditional DRAM and NAND cycles be looked at separately?
Because traditional DRAM and NAND still affect the magnitude of memory makers' cyclical swings, and the two are not synchronized, so they need to be assessed separately; HBM is only one part of the incremental narrative.
What is the difference in business structure between SK hynix and MU?
SK hynix is centered on DRAM (including HBM), while MU is balanced across DRAM and NAND. Specific revenue-share and market-share figures have not been item-by-item verified on this page, so only a structural comparison is offered.
Does HBM technology leadership mean leadership in traditional DRAM as well?
No. HBM technology leadership and leadership in traditional DRAM cost and share are different competitive dimensions and cannot be directly equated.
Once Samsung and Kioxia are included, how is the three-way exposure ranking ordered?
There is no single answer: by DRAM traditional-cycle elasticity, Samsung and SK hynix rank higher, MU comes next, and Kioxia is essentially absent; by NAND price-cycle elasticity, Kioxia is close to a pure NAND exposure, MU comes next, and Samsung and SK hynix are relatively diversified.
If I want to cover both cycles, who should I use as the reference?
You can use MU as the intersection reference for DRAM and NAND, because its business is balanced across both and it is exposed to both cycles at the same time.
Related Terms
Done comparing? Ready to place your first trade?
The crypto assets, tokenized US stocks and ETFs you just compared are all tradable on MSX — spot or perpetuals.
Quick Start Trading →New here? Registration takes three quick steps.