Micron vs SK Hynix Beyond the Basics: A Companion Comparison of HBM Customer Structure and Capacity Allocation for 2026
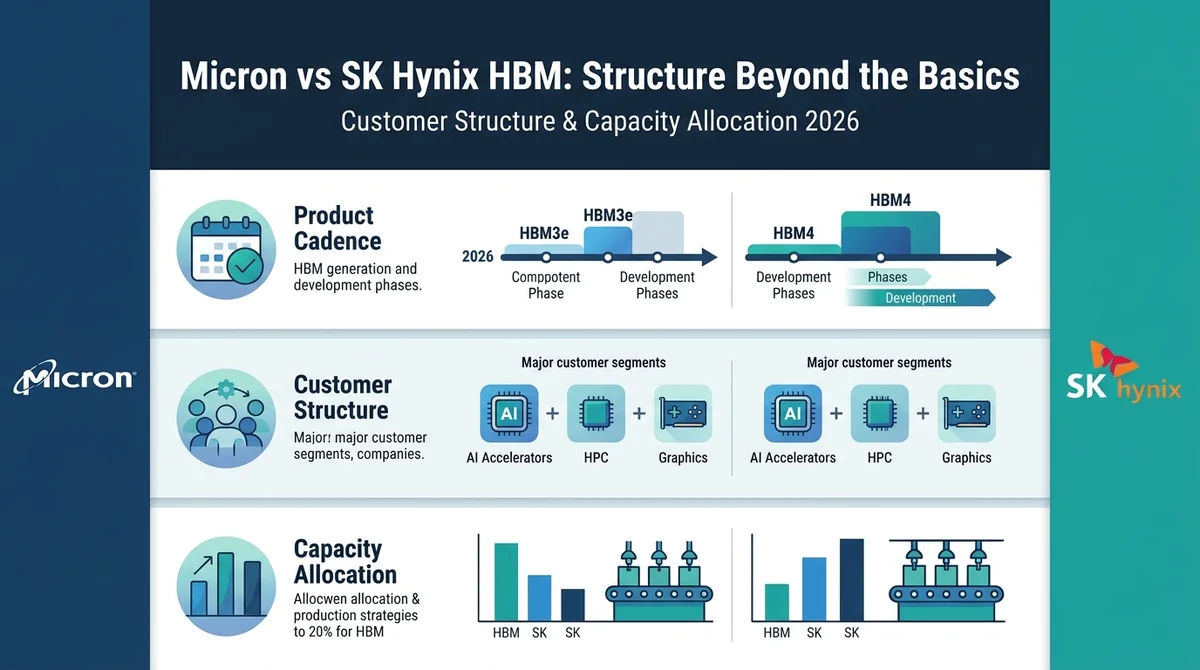
Micron vs SK Hynix HBM differences hinge on customer concentration and capacity allocation pace, not single product specs. A four-dimension structural comparison.
Conclusion: The differences between Micron and SK Hynix in HBM lie mainly not in single product parameters, but in two structural threads: customer structure and capacity allocation pace. The former affects order stability, the latter affects supply elasticity, and only their intersection yields a comparable cycle-position judgment. This article provides structural comparison only, not price forecasts.
#MU vs SK Hynix: Where Exactly Do Their HBM Businesses Differ?
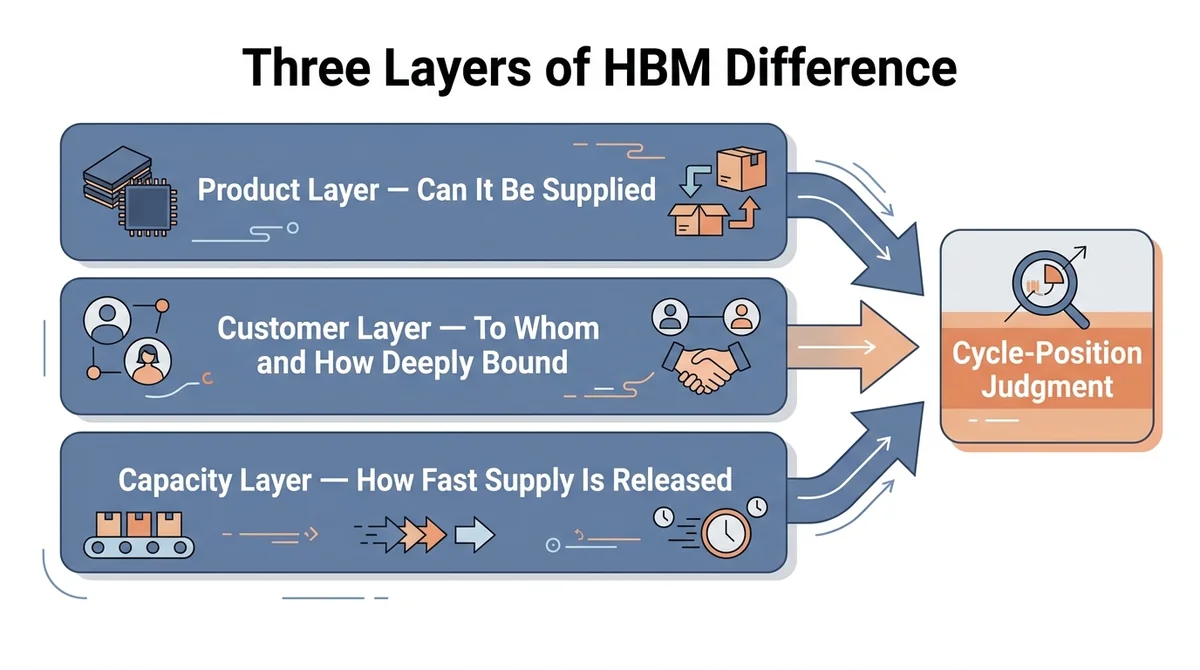
The HBM differences between Micron and SK Hynix first show up in customer concentration rather than product parameters. The product layer determines "can it be supplied," the customer layer determines "to whom and how deeply bound," and the capacity layer determines "how fast supply is released." Looking at any single layer in isolation distorts the picture.
The HBM business differences between the two companies need to be broken into three layers: products and generational cadence, customer structure, and capacity allocation. The product layer is "can it be supplied," the customer layer is "to whom and how deeply bound," and the capacity layer is "how fast supply is released." Any single layer viewed alone will be distorted.
Product positioning: Both companies treat HBM generational iteration as their core competitive axis. Specific product parameters and generational mass-production timelines should defer to official company disclosures; this article does not cite unverified figures, and related detail data is undisclosed or pending verification.
Customer structure differences: Reflected in customer concentration and binding methods—that is, how revenue is distributed across a small number of customers, and the stickiness differences arising from long-term agreements and qualification cycles.
Capacity allocation pace: Reflected in expansion cadence and capital expenditure direction, affecting how quickly supply elasticity is released.
#HBM Customer Structure Comparison: Who Relies More on a Single Customer?
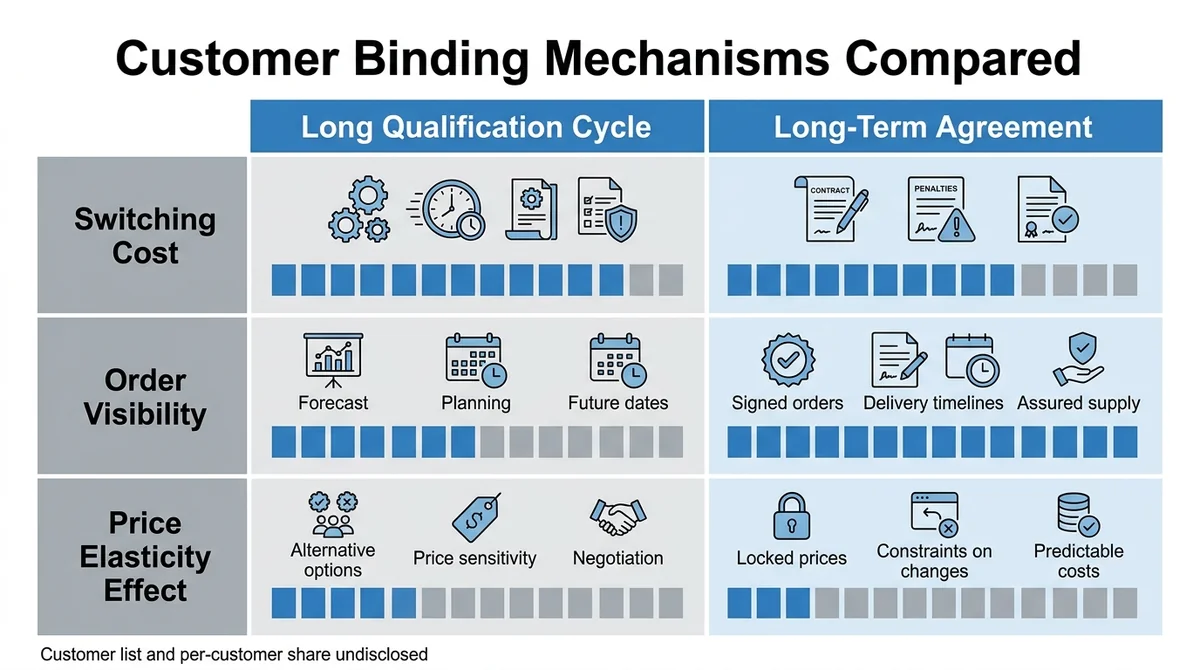
The HBM customer structure differences between Micron and SK Hynix mainly appear in two dimensions: customer concentration and binding method. Neither company's specific customer list nor per-customer share is disclosed, so it is impossible to determine who relies more on a single customer; only the structural features of binding mechanisms can be compared.
One-line conclusion: It is impossible to determine who relies more on a single customer, because neither company discloses its customer list or per-customer share; what is comparable is the binding mechanism—a long qualification cycle means high switching costs and strong order visibility, while long-term agreements pull forward volume certainty but may lock in price elasticity. (Data undisclosed; conclusion is a structural inference.)
What high customer concentration means: Order elasticity is large—revenue rises fast when a single customer ramps up; but cyclical swings may also be more pronounced, and revenue is revised down just as fast when a customer cuts orders or switches suppliers. Concentration is a double-edged sword, not simply good or bad.
Differences in customer binding methods: Long-term agreements and qualification cycles are two different sources of stickiness. Products with long qualification cycles carry high switching costs and relatively strong order visibility; long-term agreements pull forward volume certainty but may lock in price elasticity.
How customer structure affects cyclical swings: A combination of high concentration plus weak binding may carry higher cyclical sensitivity; a combination of high concentration plus strong binding (long-term agreements, long qualification) partially smooths volatility but raises single-point dependency risk. The above is structural inference, not disclosed fact.
Data boundaries: The specific customer lists and per-customer shares of both companies are undisclosed; this article makes no inference about customer identities.
#HBM Capacity Allocation Comparison: Who Is Expanding More Aggressively?
The key to HBM capacity allocation is not the total but the structure: the share of a given capital expenditure directed to HBM-related production lines determines the actual supply increment. Neither company's specific wafer starts nor HBM share is disclosed; the degree of expansion aggressiveness should be checked against the actual delivery of each company's capital expenditure guidance, not judged by impression.
One-line conclusion: HBM capacity allocation should be viewed by structure rather than total—capital expenditure direction is intent, expansion cadence is execution; neither company's wafer starts nor HBM share is disclosed, so aggressiveness can only be checked against the fulfillment of official capital expenditure guidance. (Data undisclosed.)
How capacity allocation affects supply elasticity: HBM capacity must be allocated between HBM and conventional memory products, and the allocation ratio affects the actual HBM supply increment from the same capital expenditure.
How to compare expansion cadence with capital expenditure: Capital expenditure direction (the share directed to HBM-related lines) and expansion cadence (the time distribution of new capacity release) should be viewed separately—the former is intent, the latter is execution.
What capacity release means for the cycle: Fast capacity release means large supply elasticity and rapid volume growth during industry upswings, but it may also intensify price pressure during downturns. This is a matter of cadence, not of superiority.
Data boundaries: Specific capacity figures (wafer starts, HBM share) are undisclosed; this article does not cite estimated values.
#Key Differences Between Micron and SK Hynix in One Table
How to read the tables: first look at structure (customer structure, concentration), then cadence (capacity allocation, expansion pace), and finally disclosure transparency—transparency determines how far you can push your conclusions.
Table 1: Confirmed structural differences (qualitative)
| Comparison dimension | Micron | SK Hynix |
|---|---|---|
| HBM product positioning | Generational iteration as core axis | Generational iteration as core axis |
| Binding method | Long-term agreements and qualification cycles coexist (qualitative) | Long-term agreements and qualification cycles coexist (qualitative) |
| Cyclical sensitivity | Structural inference: depends on concentration × binding strength | Structural inference: depends on concentration × binding strength |
| Disclosure transparency | Per investor relations disclosures | Per investor relations disclosures |
Table 2: Items pending verification (data undisclosed)
| Comparison dimension | Micron | SK Hynix |
|---|---|---|
| Specific product parameters | Data undisclosed, pending official disclosure | Data undisclosed, pending official disclosure |
| Customer structure | Data undisclosed (list and shares not disclosed) | Data undisclosed (list and shares not disclosed) |
| Customer concentration | Data undisclosed | Data undisclosed |
| Capacity allocation | Data undisclosed (HBM share not disclosed) | Data undisclosed (HBM share not disclosed) |
| Expansion cadence | Must be checked against capital expenditure guidance | Must be checked against capital expenditure guidance |
| Capital expenditure direction | Per official guidance | Per official guidance |
Missing items in the tables are uniformly marked as "data undisclosed" and are all pending verification; Table 1 retains only qualitative differences that can be publicly verified, to avoid invalidating the whole table.
#Memory Chip Cycle Comparison: How Do Structural Differences Affect Cycle Position?
Memory chip cycle comparison should view two lines side by side: order visibility and supply release cadence. Looking only at capacity ignores order quality; looking only at customers ignores the pace of supply-side execution; only their intersection determines the robustness of the cycle position, and neither constitutes a basis for price forecasts.
One-line conclusion: The memory chip cycle position is jointly determined by order visibility and supply release cadence—when order stability is high and supply elasticity is controllable, the cycle position is relatively stable; when order stability is low and supply elasticity is large, volatility may be amplified in both directions. (Structural inference, not a price forecast.)
Cross impact: Customer structure affects order stability, and capacity allocation affects supply elasticity. High order stability plus controllable supply elasticity makes the cycle position relatively stable; low order stability plus large supply elasticity may amplify cyclical swings in both directions.
Signals to watch in cycle comparison: First, order visibility (long-term agreement coverage ratio, qualification progress); second, supply release cadence (expansion execution timeline); third, product generational transition nodes.
Why you cannot look at a single indicator: Looking only at capacity ignores order quality; looking only at customers ignores the pace of supply-side execution. The two must be viewed side by side, and neither constitutes a basis for price forecasts.
#What Risks and Definitional Limits Should Be Noted When Comparing HBM Businesses?
Data disclosure limits: Customer lists, per-customer shares, and specific capacity figures mostly fall within undisclosed scope; any comparison precise to the number needs to be checked against official company disclosures.
Definitional differences: The statistical basis for HBM capacity (wafer starts / output / equivalent capacity) may differ across companies, and direct cross-company subtraction easily leads to misreading.
Scope of applicability: The conclusions of this article serve only as structural comparison and methodological reference, and do not constitute judgments about any company's future performance or share price.
This content is compiled from public information and does not constitute investment or open account advice. Data as of 2026-01-01; actual conditions may change.
To check the latest disclosures, refer to the official sources on the two companies' investor relations pages.
#FAQ
What is the single most core difference between Micron and SK Hynix in HBM? It is not a single product parameter, but the combination of customer structure and capacity allocation pace: the former affects order stability, the latter affects supply elasticity. Only their intersection yields a comparable cycle-position judgment.
Is high customer concentration good or bad? Neutral, leaning double-edged. High concentration means revenue rises fast when a single customer ramps up, but it is revised down just as fast when a customer cuts orders or switches suppliers, and cyclical swings may be amplified.
Can the two companies' specific customer lists and capacity figures be found? Specific customer lists, per-customer shares, and precise capacity figures mostly fall within undisclosed scope; this article uniformly marks them as data undisclosed and makes no inference. When precise figures are needed, check official company disclosures.
Why can't you look only at capacity or only at customer structure? Looking only at capacity ignores order quality; looking only at customers ignores the pace of supply-side execution. Order stability and supply elasticity must be assessed side by side, otherwise cycle position is easily misjudged.
Does this article provide price forecasts or buy/sell advice? No. This article provides only business structure comparison and methodological explanation; it makes no price forecasts and does not constitute investment advice.
Between Micron and SK Hynix, who relies more on a single customer for HBM? It cannot be determined. Neither company discloses its customer list or per-customer share; only binding mechanisms can be compared—a long qualification cycle means high switching costs and strong visibility, while long-term agreements pull forward volume certainty but may lock in price elasticity.
How should HBM capacity allocation be viewed? By structure rather than total. Capital expenditure direction (the share directed to HBM lines) and expansion cadence (the time distribution of new capacity release) should be viewed separately—the former is intent, the latter is execution; specific wafer starts and HBM share are undisclosed and must be checked against official guidance.
Where do the HBM customer structure differences between Micron and SK Hynix show up? In two dimensions: customer concentration and binding method. Neither company's specific customer list nor per-customer share is disclosed, so it is impossible to determine who relies more on a single customer; only the structural stickiness differences from long-term agreements and qualification cycles can be compared.
What signals should a memory chip cycle comparison watch? View order visibility and supply release cadence side by side. For order visibility, watch long-term agreement coverage ratios and qualification progress; for the supply side, watch expansion execution timelines and generational transition nodes; a single indicator easily misjudges cycle position.
FAQ
What is the single most core difference between Micron and SK Hynix in HBM?
It is not a single product parameter, but the combination of customer structure and capacity allocation pace: the former affects order stability, the latter affects supply elasticity. Only their intersection yields a comparable cycle-position judgment.
Is high customer concentration good or bad?
Neutral, leaning double-edged. High concentration means revenue rises fast when a single customer ramps up, but it is revised down just as fast when a customer cuts orders or switches suppliers, and cyclical swings may be amplified.
Can the two companies' specific customer lists and capacity figures be found?
Specific customer lists, per-customer shares, and precise capacity figures mostly fall within undisclosed scope; this article uniformly marks them as data undisclosed and makes no inference. When precise figures are needed, check official company disclosures.
Why can't you look only at capacity or only at customer structure?
Looking only at capacity ignores order quality; looking only at customers ignores the pace of supply-side execution. Order stability and supply elasticity must be assessed side by side, otherwise cycle position is easily misjudged.
Does this article provide price forecasts or buy/sell advice?
No. This article provides only business structure comparison and methodological explanation; it makes no price forecasts and does not constitute investment advice.
Related Terms
Done comparing? Ready to place your first trade?
The crypto assets, tokenized US stocks and ETFs you just compared are all tradable on MSX — spot or perpetuals.
Quick Start Trading →New here? Registration takes three quick steps.